Alpha in Finance The Ultimate Guide to Risk Adjusted Returns
Alpha is the holy grail of active investing, representing the ‘edge’ a portfolio manager or strategy has over the market. It quantifies performance that surpasses a benchmark’s results after accounting for the level of risk taken. Understanding alpha is key to distinguishing skill from luck in the financial markets and justifying active management fees.
Summary Table
| Aspect | Detail |
|---|---|
| Definition | This metric represents the profit an investment earns above the return of a benchmark, once risk factors have been considered. |
| Also Known As | Excess Return, Abnormal Rate of Return |
| Main Used In | Portfolio Management, Hedge Funds, Mutual Fund Analysis, Performance Measurement |
| Key Takeaway | A positive value signals that a manager’s expertise has beaten the market, whereas a negative value points to a failure to meet benchmark returns. |
| Formula | α = Rp – (Rf + β(Rm – Rf)) |
| Related Concepts |
What is Alpha
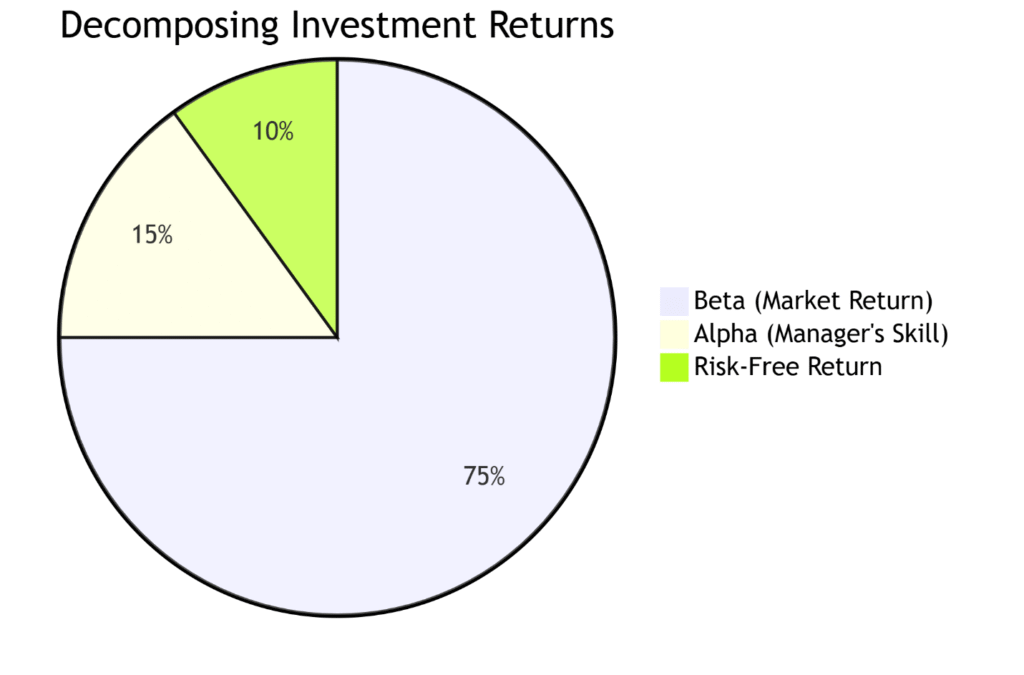
In simple terms, alpha is the value a portfolio manager adds to or subtracts from a fund’s return. It captures the segment of gains attributable to a manager’s specific choices, separate from broader market fluctuations. If the market goes up 10% and your portfolio gains 15%, your alpha isn’t simply 5%; it’s the risk-adjusted portion of that 5% excess return.
Think of it like a race. The benchmark index (like the S&P 500) is the expected speed for a standard car on a given track. Beta is how much your car’s speed amplifies or reduces the changes in the track’s conditions (i.e., market risk). Alpha, however, is purely the skill of your driver. A positive alpha means your driver navigated the track more efficiently than anyone expected, generating a better result through skill alone.
Key Takeaways
In essence, the pursuit of alpha is synonymous with the search for genuine investing proficiency. While difficult to achieve consistently, understanding it empowers you to make smarter decisions about where to place your capital.
The Core Concept Explained
Alpha measures performance after accounting for risk. Its theoretical foundation comes from the Capital Asset Pricing Model (CAPM), a formula that calculates an asset’s anticipated return using its beta (market correlation) and the prevailing risk-free rate.
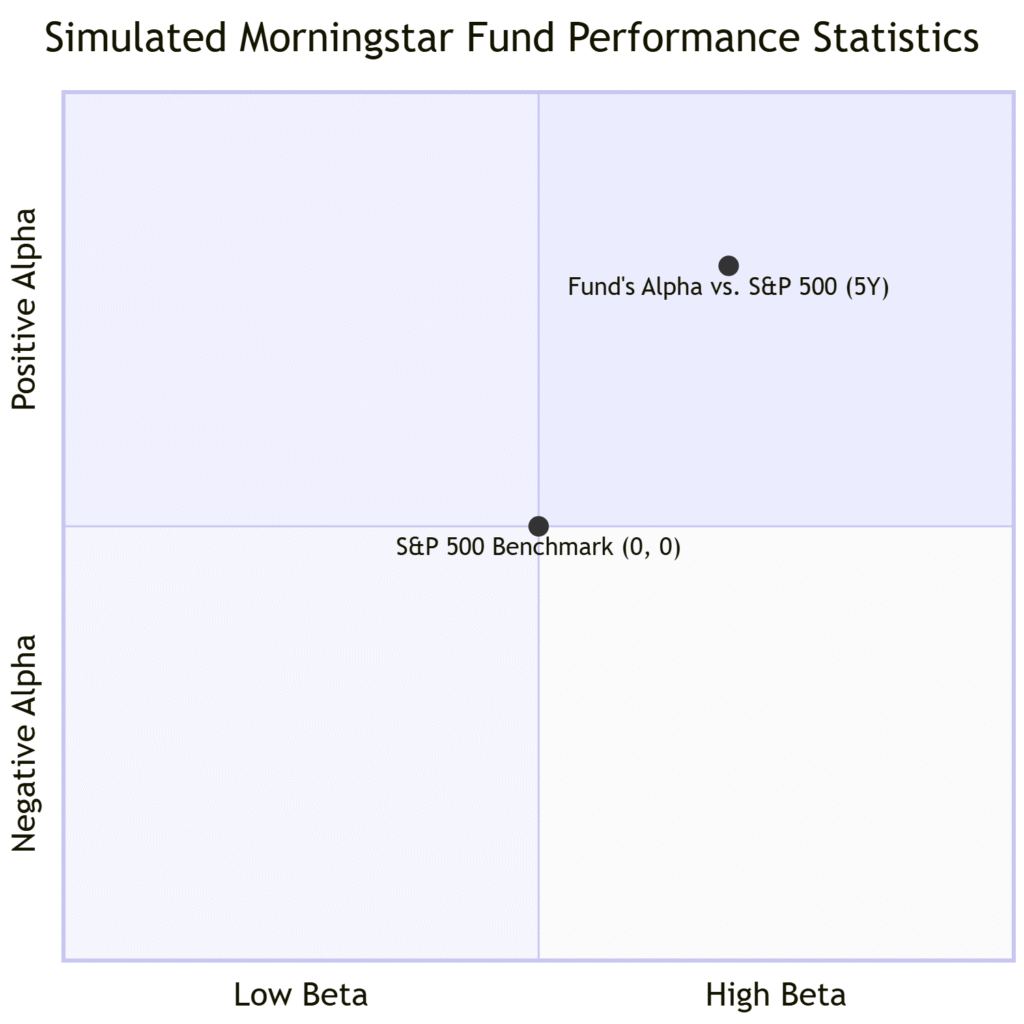
- A positive alpha of 1.0 means the investment outperformed its benchmark index by 1% after adjusting for risk. A reading of 5.0 signifies that the investment beat its benchmark by five percent. This is the goal of active management.
- A value of -2.0 shows that, after adjusting for risk, the investment trailed its benchmark by two percent.
- An alpha of zero suggests the investment earned a return exactly commensurate with the risk taken, matching the benchmark.
How to Calculate Alpha
The most common formula for calculating alpha is derived from the Capital Asset Pricing Model (CAPM):
α = Rp – (Rf + β(Rm – Rf))
Where:
- α = Alpha
- Rp = Realized return of the portfolio
- Rf = Risk-free rate (e.g., 10-year U.S. Treasury yield)
- β = Beta of the portfolio
- Rm = Expected market return (benchmark return)
Step-by-Step Calculation Guide
Let’s walk through a real-world example.
Scenario: You want to calculate the alpha of a mutual fund over the past year.
- Gather Your Input Values:
- Portfolio Return (Rp): 12%
- Risk-Free Rate (Rf): 3%
- Benchmark Return (Rm): 10%
- Portfolio Beta (β): 1.2
- Perform the Calculation:
First, calculate the expected return using CAPM:
Expected Return = Rf + β(Rm – Rf)
Expected Return = 3% + 1.2 * (10% – 3%)
Expected Return = 3% + 1.2 * (7%)
Expected Return = 3% + 8.4%
Expected Return = 11.4%
Now, subtract this expected return from the actual return:
α = Rp – Expected Return
α = 12% – 11.4%
α = 0.6%
| Input Values | Calculation | Interpretation |
|---|---|---|
|
Rp = 12%
Rf = 3%
Rm = 10%
β = 1.2
|
α = 12% – (3% + 1.2*(10% – 3%)) = 0.6% | A positive alpha of 0.6% indicates the fund manager generated a 0.6% excess return over the benchmark after adjusting for the portfolio’s higher risk (beta). |
Why Alpha Matters to Traders and Investors
In the world of finance, alpha is considered the premier indicator of value added by active decision-making.
- For Investors: It helps you separate skilled fund managers from lucky ones. Before paying high fees for an actively managed fund, you want to see a consistent, positive alpha to ensure you’re paying for performance, not just market exposure (which you could get cheaply with an index ETF).
- For Portfolio Managers: Their entire reputation and justification for existence hinge on generating positive alpha. It is the report card for their stock-picking, market-timing, and risk-management skills.
- For Analysts: Alpha is used to evaluate the success of a trading strategy, model, or investment thesis. It answers the question: “Did this idea actually work, or did it just ride a market wave?”
How to Use Alpha in Your Strategy
- Use Case 1: Mutual Fund & ETF Selection. When comparing two similar funds, always check their long-term (5+ year) alpha. A fund with a higher, consistent alpha is likely better managed than one with a lower or negative alpha, even if their raw returns are similar.
- Use Case 2: Performance Attribution. If you manage your own portfolio, calculate your alpha periodically. It will tell you if your picks are beating the market because of your skill (positive alpha) or simply because you’re taking on more risk (high beta).
- Use Case 3: Strategy Backtesting. When developing a new trading strategy, its historical alpha is the key metric to determine if it has a genuine edge or is just fitting noise from past data.
Pros and Cons of Alpha
- Risk-Adjusted Measure: Alpha’s biggest strength is that it accounts for risk (via beta), giving a clearer picture of performance than raw return alone.
- Universal Benchmarking: It allows for the comparison of any investment against a relevant benchmark, from stocks to real estate.
- Core to Active Management: It provides a clear, quantitative goal for fund managers to justify their fees and demonstrate skill.
- Performance Attribution: Helps investors distinguish between market performance and manager skill in generating returns.
- Standardized Metric: As a widely accepted measure, alpha allows for consistent comparison across different funds and strategies.
- Depends on the Right Benchmark: Alpha is meaningless if measured against the wrong benchmark (e.g., measuring a tech stock fund against a utilities index).
- Historical Measure: It tells you about past performance, which is not a guarantee of future results.
- Relies on Beta: Since the calculation uses beta, alpha is only as reliable as the beta measurement. Beta can be unstable over time.
- Doesn’t Capture All Risks: Alpha primarily measures market risk (beta) but may not account for other risks like liquidity or concentration risk.
- Can Be Manipulated: Fund managers might manipulate benchmarks or time periods to make their alpha appear more favorable.
Alpha in the Real World: A Case Study
The career of Peter Lynch, who managed the Fidelity Magellan Fund from 1977 to 1990, is a legendary example of alpha generation. During his tenure, the fund averaged an astonishing 29.2% annual return.
More importantly, it consistently generated significant positive alpha by outperforming the S&P 500 index in 11 of those 13 years. This wasn’t just luck or a rising market; it was a demonstration of skill in stock-picking and strategy that added immense value for shareholders. Lynch’s ability to find “ten-baggers” (stocks that grow tenfold) was the direct source of this alpha, solidifying his reputation as one of the greatest investors of all time.
How Alpha Relates to Other Concepts
Alpha is most often confused with Beta. While related in the CAPM model, they measure entirely different things.
| Feature | Alpha (α) | Beta (β) |
|---|---|---|
| What it measures | Performance due to skill (excess return). | Systematic risk (sensitivity to the market). |
| Represents | Idiosyncratic, active return. | Passive, market-driven return. |
| Goal for Investors | Maximize (seek positive alpha). | Manage (choose a beta that matches risk tolerance). |
| Controlled By | Manager skill, strategy, stock selection. | The overall portfolio’s volatility relative to the market. |
Related Terms
- Beta: A metric that gauges how much an asset’s price tends to fluctuate compared to the overall market’s movements. It’s a core component in the alpha calculation.
- Sharpe Ratio: Another risk-adjusted performance metric that uses standard deviation (total risk) instead of beta (systematic risk) to measure volatility.
- Jensen’s Alpha: This is actually the same calculation we’ve discussed; it’s simply the formal name for the alpha derived from the CAPM model.
- Capital Asset Pricing Model (CAPM): The economic model that provides the foundation for calculating expected return and, by extension, alpha.
Frequently Asked Questions
Recommended Resources
- Investopedia: Alpha Definition – A fantastic in-depth resource.
- SEC.gov: Investor Bulletin: Mutual Fund Fees and Expenses – Understanding the costs associated with funds that aim for alpha.
- Journal of Finance: The Grossman-Stiglitz Paradox – A seminal academic paper on the difficulty of achieving alpha in efficient markets.
How did this post make you feel?
Thanks for your reaction!
