Bitcoin at a Climactic Resistance Risk of Sharp Reversal to $109K
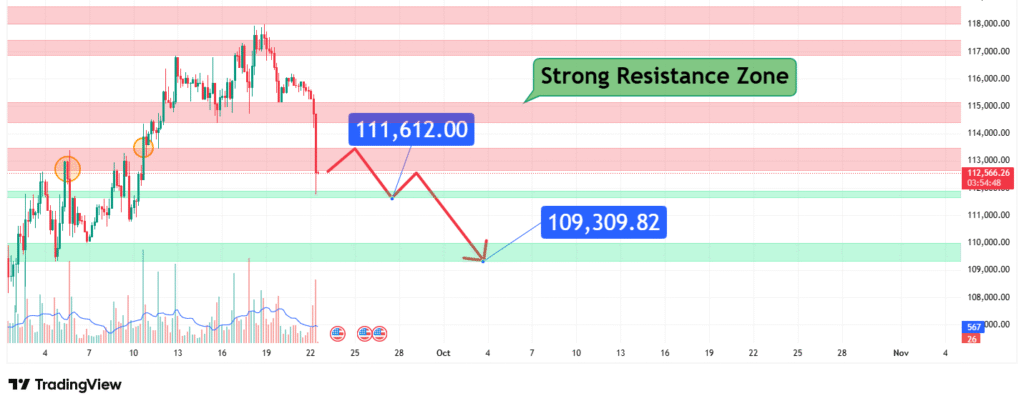
Bitcoin’s price has rallied strongly and is now interacting with a significant and technically robust Strong Resistance Zone between $109,309 and $111,612. This price action suggests that buyers are becoming exhausted at these elevated levels. Our analysis projects a bearish rejection from this zone, leading to a pullback towards the lower boundary of the resistance zone at $109,309. This prediction is based on a confluence of technical factors, including the test of a major resistance confluence and potential signs of buyer exhaustion on lower timeframes.
Current Market Structure and Price Action
The broader market structure for Bitcoin remains bullish, characterized by a consistent series of higher highs and higher lows. However, the price is now testing a potentially climactic level. The current interaction with the Strong Resistance Zone is a critical test of bullish conviction. Recent price action shows BTC is struggling to break cleanly above the $111,612 level, indicating that selling pressure is mounting at this height. This often creates conditions ripe for a healthy pullback to gather liquidity and momentum for the next leg up.
Identification of the Key Resistance Zone
The most critical technical element on the chart is the Strong Resistance Zone between $109,309 and $111,612. The strength of this zone is derived from:
- Historical Significance: This level has acted as a major previous all-time high or a significant swing high, making it a psychologically important price ceiling.
- Technical Confluence: The zone is not a single price but a band, encompassing two critical levels ($109,309 and $111,612). This creates a dense area of sell orders and profit-taking, rather than a thin line of resistance.
- Market Psychology: This area represents a massive profit-taking zone for long-term holders and a logical point for new short positions. The sentiment often shifts from “buy the dip” to “sell the rip” at such pronounced technical levels.
This strong confluence makes it a high-probability level for a bearish reaction.
Technical Target(s) and Rationale
Our analysis identifies the following price targets:
Primary Target (PT1): $109,309
This is the lower boundary of the strong resistance zone. A pullback from the upper extremes would likely seek to retest this level as new support. A successful hold here would be a classic bull market behavior—retesting a broken resistance level to confirm it as support before continuing higher.
Secondary Target (PT2): ~$107,000 (Approx.)
A more significant break below $109,309 could see a deeper pullback towards the next major support level or a key moving average (e.g., the 20-day EMA), which often acts as a dynamic support in strong trends.

Prediction: We forecast that BTC will face rejection near the $111,612 level and initiate a pullback towards our primary target at $109,309.
Risk Management Considerations
A professional strategy is defined by its risk management.
- Invalidation Level (Stop-Loss): The entire bearish (pullback) thesis is invalidated if the price achieves a sustained daily close above $112,000. A decisive break and close above the entire resistance zone, particularly above $112,000, would signal exceptional strength and likely trigger a FOMO-driven rally to much higher prices, negating the immediate pullback forecast.
- Position Sizing: Any short-term bearish positions or hedging strategies should be sized so that a loss triggered at the invalidation level represents a small, pre-defined percentage of your total capital (e.g., 1-2%).
Fundamental Backdrop
The technical setup is framed by the current fundamental landscape:
- Overbought Conditions: The rally into this resistance has been significant, leading to overbought readings on many momentum oscillators, which often precede a consolidation or pullback phase.
- Macroeconomic Sensitivity: Bitcoin remains sensitive to broader macroeconomic factors, including US Dollar strength and equity market performance. Any risk-off sentiment could catalyze the projected move.
- Volatility Compression: A rejection at resistance often leads to an expansion of volatility, which could accelerate the move down towards the target.
Conclusion
Bitcoin is testing a critical technical resistance level. The weight of evidence from this confluence zone suggests a high probability of a bearish rejection and a pullback towards $109,309. Traders should monitor for signs of exhaustion (e.g., long wicks, bearish engulfing patterns) at this zone and manage risk diligently by respecting the key invalidation level at $112,000. A successful hold at the $109,309 target would be a healthy development for the ongoing bull market.
Chart Source: TradingView
Disclaimer: This analysis is for informational and educational purposes only and does not constitute financial advice or a recommendation to buy or sell any security. All trading and investing involves significant risk, including the possible loss of your entire investment. Always conduct your own research (DYOR) and consider seeking advice from an independent financial professional before making any trading decisions.


