
BTC Price Warning Why the Trend Line Break is a Bull Trap Targeting $98K
Bitcoin’s recent price action, which saw it break above a local descending trend line, has undoubtedly captured bullish attention. Currently trading near $113,410, the asset appears to be demonstrating strength. However, a deeper technical analysis reveals alarming divergences and classic characteristics of a market top. This article posits a contrarian yet compelling thesis: the recent breakout is not a launchpad for new all-time highs but a bull trap, a final maneuver to liquidate late short positions and entice eager buyers before a significant reversal. The weight of evidence suggests an impending downward move of substantial magnitude, targeting key support levels far below the current price.
The Anatomy of a Bull Trap: Why This Breakout is Different
A genuine bullish breakout is typically characterized by strong, sustained volume and a decisive move that leaves the broken resistance level far behind. The current scenario, however, exhibits hallmarks of a deceptive move. The price action since the last major high resembles a complex distribution pattern, potentially a large-scale Head and Shoulders top formation. In this interpretation, the previous high constitutes the “Left Shoulder,” the push to ~$73k forms the “Head,” and the current rally is completing a lower “Right Shoulder.” The breakout above the short-term trend line is merely the right side of this shoulder, occurring on what is likely weakening momentum and declining volume, a sign of institutional distribution, not accumulation. This creates a trap for retail bulls just before a steep decline.
Bearish Price Projection: Mapping the Path to $89,079
The primary utility of identifying a major reversal pattern is its ability to provide a measurable forecast. The minimum downside target is derived by measuring the height of the pattern’s “Head” from its “neckline” and projecting that distance downward from the point of neckline breakdown. Applying this methodology to the hypothesized large-scale topping formation yields two critical bearish targets.
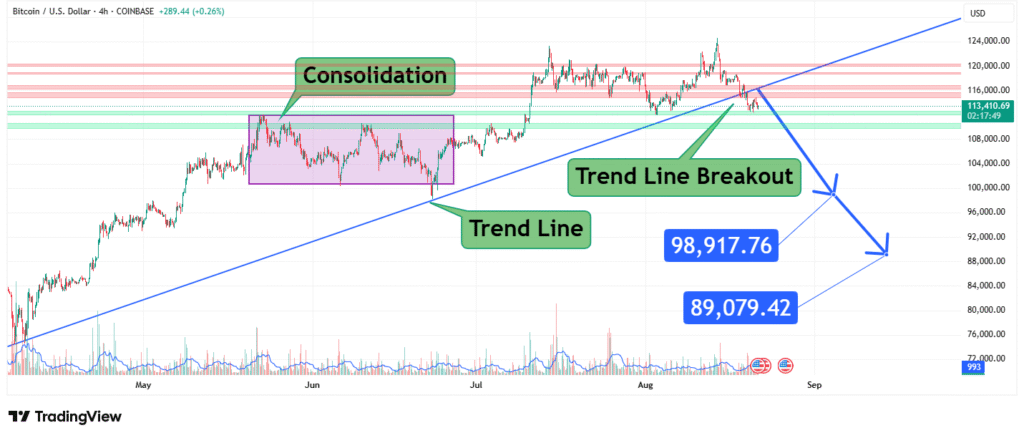
- Primary Target ($98,917): This represents the initial and minimum projected target for the anticipated decline. It is a significant technical and psychological level where the market would be expected to find initial, potentially volatile, support.
- Secondary Target ($89,079): A break below the primary target would likely intensify selling momentum, pushing the price toward this deeper support zone. This level represents a more profound correction and is the focal point of this bearish prediction.
From the current price of $113,410, a move to the primary target constitutes a ~12.8% decline, while a full move to the secondary target represents a ~21.5% correction.
Risk Management: The Bullish Invalidation Level
No technical analysis is complete without defining the conditions that would prove the thesis wrong. For this bearish outlook to be invalidated, Bitcoin would need to demonstrate undeniable strength by achieving a sustained daily and weekly close significantly above the high of the pattern’s Head (~$73,000 in this cycle), on exceptionally high volume. Such a move would shatter the proposed reversal structure and confirm that the trend line break was indeed legitimate, forcing a full reassessment of the market cycle. Until that occurs, the path of least resistance, from a structural perspective, is downward.
Conclusion
In conclusion, while the short-term chart shows a breakout, the broader technical structure paints a worrying picture of exhaustion and potential reversal. The risk of a bull trap culminating in a sharp drop to $98,917 and potentially $89,079 is exceptionally high. Traders and investors should prioritize risk management: considering profit-taking on long positions, raising stop-loss orders, or preparing hedging strategies. The current price level offers an unfavorable risk-to-reward ratio for new long entries. Prudence suggests preparing for a significant increase in volatility and a challenging corrective phase ahead.
Chart Source: TradingView
Disclaimer: This analysis represents a contrarian technical opinion and is for informational purposes only. It is not financial advice. The cryptocurrency market is extremely volatile. Always conduct your own research and manage your risk accordingly.
How did this post make you feel?
Thanks for your reaction!
