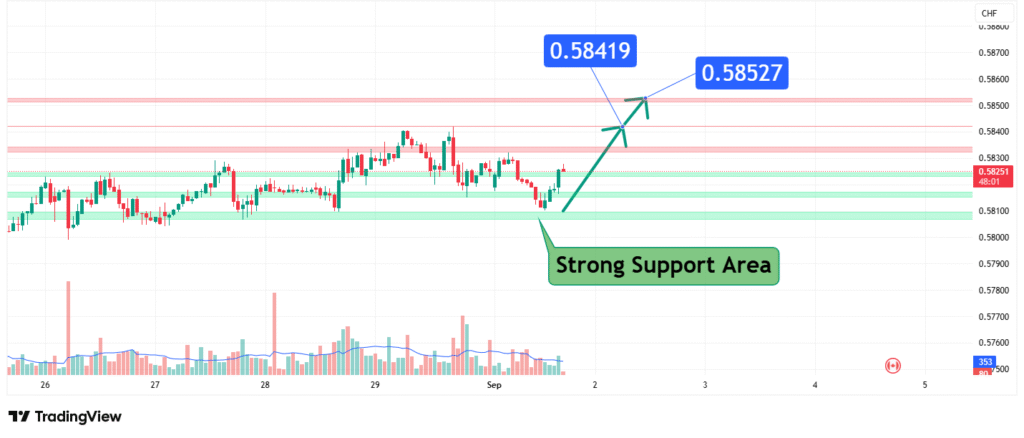
CADCHF Technical Analysis Predicting a Bounce from Key Support to 0.5850
The CADCHF pair is exhibiting a pronounced bearish trend, characterized by a series of lower highs and lower lows. The price is currently descending towards a significant and historically robust area of support, clustered between the 0.5800 and 0.5770 levels. Our analysis indicates that this zone is likely to act as a strong barrier against further immediate downside. We anticipate a potential technical rebound or consolidation upon reaching this area, with a primary short-term pullback target zone of 0.5840 – 0.5850.
Current Market Structure and Price Action
The provided chart clearly depicts a sustained bearish impulse. The price has broken below several previous support levels, confirming a shift in market sentiment in favor of the Swiss Franc. The most recent price action shows the pair trading near 0.58119, having just touched a low. The market structure remains unequivocally bearish, with sellers firmly in control.
Identification of the “Strong Support Area”
The most critical element on the chart is the highlighted “Strong Support Area”. This is not a single price line but a multi-layered zone, significantly enhancing its technical importance. This zone is defined by:
- A Congestion of Historical Price Lows: Multiple previous swing lows and reaction points are concentrated within the 0.5800 – 0.5770 range. The more times a price level has been tested and held, the more significant it becomes.
- Psychological Support: The 0.5800 level represents a major psychological round number, often attracting heightened market attention and order flow.
This confluence of factors makes this support area a high-probability region for a pause in the selling pressure or a potential reversal of the immediate downtrend.
Technical Target and Rationale
Our primary analysis points towards a retracement from the strong support zone towards the 0.5840 – 0.5850 area. This target is not arbitrary but is derived from standard technical analysis principles:
- Pullback to Broken Support (Now Resistance): A fundamental rule in technical analysis is that former support, once broken, turns into new resistance. The levels around 0.5840 – 0.5850 (with a recent high at 0.58527) previously acted as support. As price rebounds from the deeper support, it is likely to encounter selling pressure upon retesting this old support-turned-resistance zone.
- Fibonacci Retracement: A measured bounce from the deep support would likely retrace a portion of the most recent leg down. A 38.2% or 50% Fibonacci retracement of the latest bearish wave would precisely target the 0.5840 – 0.5850 region.
- Price Gap Fill: The sharp decline may have left minor price gaps on lower timeframes (e.g., 1-hour or 4-hour charts). Markets often have a tendency to “fill” these gaps, which could also propel price towards our target zone.

Prediction: We forecast that upon contacting the strong support area (0.5800 – 0.5770), the CADCHF pair will stage a technical rebound. The most logical and immediate target for this counter-trend move is the 0.5840 – 0.5850 resistance confluence.
Risk Management Considerations
A professional trade plan is defined not only by its profit target but also by its management of risk.
- Invalidation Level (Stop-Loss): The entire bullish rebound thesis is invalidated if the price sustains a decisive break below the strong support zone, particularly a daily close below 0.5760. Such a move would indicate a complete failure of the support and open the door for a further decline towards 0.5720 or lower. A stop-loss order should be placed just below this key level.
- Position Sizing: Any trades taken in anticipation of this bounce should be sized appropriately to ensure that a loss from a support break remains within acceptable risk parameters (e.g., 1-2% of total capital).
Fundamental Backdrop
While this is primarily a technical analysis, it is supported by the fundamental landscape:
- Swiss Franc (CHF): The CHF continues to be favored as a “safe-haven” currency during periods of global economic uncertainty or market volatility. This underlying bid provides a persistent tailwind for any CHF pair’s strength.
- Canadian Dollar (CAD): The CAD is a commodity-linked currency, heavily influenced by the price of oil. Recent volatility or weakness in crude oil prices can translate directly into weakness for the Canadian Dollar.
This fundamental dynamic reinforces the technical bearish bias for CADCHF but also makes a sharp bounce from a key technical area a high-probability scenario.
Conclusion
The CADCHF is navigating a critical juncture. The bearish trend is intact, but the pair is now entering a high-impact support zone where buyer defense is expected to emerge. We project a reactive bounce from this zone, aiming for a retest of the 0.5840 – 0.5850 area, which now acts as a formidable resistance. Traders should monitor price action around the support carefully for confirming bullish reversal signals (e.g., hammer candles, bullish engulfing patterns) and manage risk diligently below 0.5760.
Chart Source: TradingView
Disclaimer: This article is for informational and educational purposes only and does not constitute financial advice of any kind. All trading involves significant risk of loss. Always conduct your own research and consider seeking advice from an independent financial professional before making any trading decisions.
How did this post make you feel?
Thanks for your reaction!


