Ethereum Price Analysis ETH at Risk of Falling to $3,200
Ethereum (ETH), the second-largest cryptocurrency by market capitalization, is experiencing a pivotal moment in its price action. Recent trading patterns have highlighted a market structure break that could lead to a significant downward move if certain resistance levels hold. In this article, we’ll conduct an in-depth Ethereum price analysis, explore key resistance and support zones, and assess the potential downside targets of $3,220 and $3,100.
Current Ethereum Market Overview
As of the latest trading session, Ethereum (ETH) is priced around $3,438, showing a marginal decline of approximately 0.15% in the past 24 hours. ETH continues to trade below a critical resistance zone identified on the hourly chart, suggesting that bearish momentum may still dominate in the short term.
Ethereum’s price action in recent weeks has been characterized by a gradual decline from the $3,900 premium zone toward the discount zone around $3,200–$3,100. This downward trend aligns with broader market weakness, as Bitcoin and other altcoins also show similar retracements after their mid-year rallies.
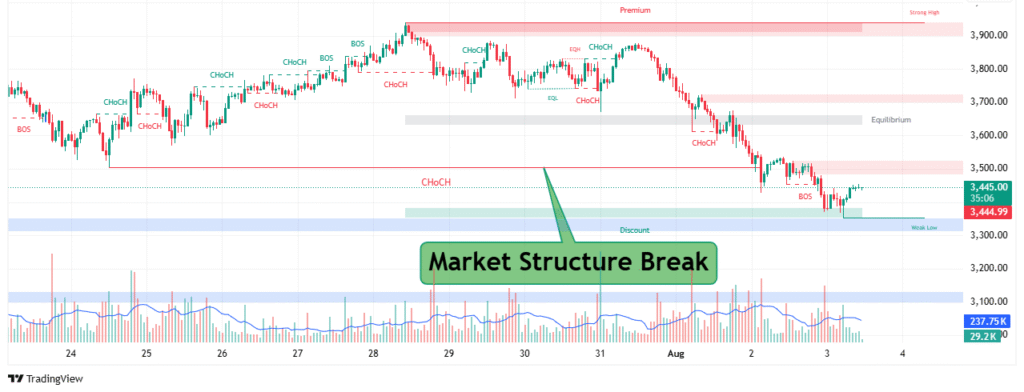
Understanding the Market Structure Break
A market structure break (MSB) occurs when price action violates a key support or resistance level, signaling a potential shift in trend. In this case, Ethereum recently broke below a major structural support around $3,500, creating a bearish bias.

Why This Break Matters
- Shift in Momentum: The move below $3,500 invalidated prior bullish structures, confirming a bearish market shift.
- Liquidity Grab: Price has swept liquidity zones above previous equal highs (EQH) and equal lows (EQL), a common precursor to deeper retracements.
- Lower High Formation: After the structure break, ETH has been forming lower highs, a classic bearish continuation pattern.
This break sets the stage for potential targets lower, especially if ETH fails to reclaim the broken support now acting as resistance.
Resistance Levels to Watch
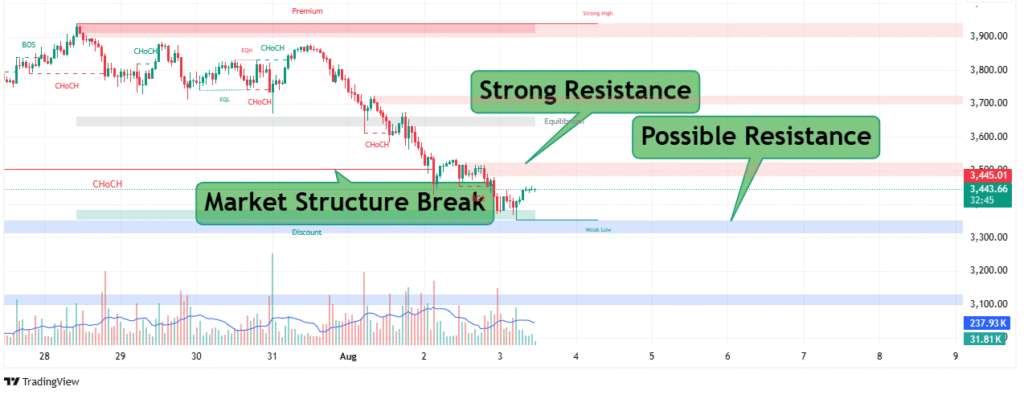
One of the most crucial elements in this Ethereum price analysis is the highlighted resistance level around $3,500–$3,550. According to the chart structure:
- This zone previously acted as support during ETH’s consolidation phase.
- After the break of structure, the same zone has flipped into resistance.
- If Ethereum fails to break above this resistance, sellers are likely to gain control and push prices lower.

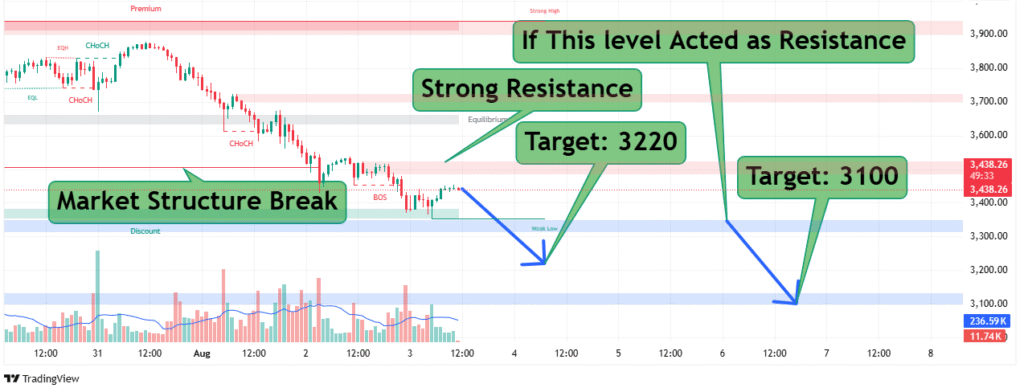
“If This Level Acts as Resistance”
The chart annotation, “If this level acted as resistance,” underscores the importance of this zone. Historically, when support levels flip to resistance (a phenomenon known as support-turned-resistance), price often retests the level before continuing downward.
If Ethereum confirms this resistance, bearish targets come into focus at $3,220 and potentially $3,100.
Bearish Targets: $3,220 and $3,100
Following the break of structure and rejection from the resistance zone, Ethereum’s next likely move could be toward the discount zone, marked on the chart.

Target 1: $3,220
- This level aligns with previous weak lows and minor liquidity zones.
- A move to $3,220 would represent an approximate 6% decline from current levels.
- It may act as an intermediate support, offering a potential short-term bounce.
Target 2: $3,100
- This is the deeper target and aligns with major demand zones from earlier accumulation phases.
- A test of $3,100 would represent a 10% correction from current prices.
- Historically, strong buyer interest has emerged in this zone, making it a crucial level for long-term bulls.
Volume and Momentum Analysis
Volume data from the chart reveals declining bullish participation during minor rallies, while sell-side volume spikes during breakdowns. This volume profile supports the bearish outlook:
- Volume Climax on Breakdown: Large sell candles accompanied the market structure break.
- Weak Buying Pressure: Attempts to recover above $3,500 lacked convincing volume.
Momentum indicators like RSI and MACD (not shown in the chart but relevant in analysis) also suggest weakening bullish momentum, supporting a continued downside move.
Premium and Discount Zones
The chart also highlights premium and discount pricing zones:
- Premium Zone (Above $3,700–$3,900): Represents overextended price levels where sellers often dominate.
- Discount Zone ($3,100–$3,200): Represents value areas where buyers are likely to accumulate.
Given ETH’s current position near the midpoint (equilibrium), the path of least resistance appears to be toward the discount zone, especially if the resistance holds.
Key Takeaways from the Chart
- Market Structure Break: Confirmed below $3,500, flipping previous support into resistance.
- Resistance Validation: Watch for price reaction at $3,500–$3,550; failure to reclaim could accelerate downside.
- Downside Targets: $3,220 (intermediate) and $3,100 (major support).
- Volume Confirms Bearish Bias: High sell volume on breakdowns and weak buy volume on rallies.
- Premium vs Discount Dynamics: Current positioning favors a move toward discount levels.
Broader Market Context
Ethereum’s performance cannot be analyzed in isolation. Macro factors influencing its price include:
- Bitcoin Correlation: BTC’s inability to sustain above $60,000 has pressured ETH and altcoins.
- Macro Sentiment: Ongoing global economic uncertainty and Fed policies impact risk assets.
- Ethereum Upgrades: Future network upgrades (e.g., proto-danksharding) may affect long-term bullish sentiment but have limited immediate impact.
Trading Strategy Insights
For traders and investors, understanding these key levels can help shape strategy:
- Short-Term Traders: Look for confirmation of resistance around $3,500 to enter short positions toward $3,220 and $3,100.
- Long-Term Investors: Consider accumulating in the discount zone ($3,100–$3,200) if macro and on-chain indicators support a bottoming process.
- Risk Management: Place stop-loss orders above resistance to manage potential upside breakouts.
Conclusion: Is Ethereum Heading to $3,100?
The current Ethereum price analysis suggests a bearish outlook if the resistance level around $3,500 holds. The market structure break indicates a shift in trend, with clear downside targets at $3,220 and $3,100. Traders should watch how ETH reacts to this key resistance; a rejection could confirm the bearish continuation, while a breakout might invalidate the downside targets.
As always, combining technical analysis with broader market sentiment and fundamental factors is essential for informed trading decisions.


