GBPUSD Bullish Setup Eyeing a Rally to 1.359 After Holding Key Support
The GBP/USD pair has been consolidating and showing signs of buyer accumulation within a defined Strong Support Zone after a prolonged downtrend. This price action suggests a potential bullish reversal or a significant corrective bounce is forming. Our analysis projects a move towards a primary target of 1.35910, with an intermediate target at 1.35280. This prediction is based on a confluence of technical factors, including the defense of a critical support area and potential exhaustion of the prior bearish momentum.
Current Market Structure and Price Action
The broader market structure has been bearish, characterized by a series of lower highs and lower lows. However, the price has now entered a Strong Support Zone and is showing signs of stabilization. The recent price action has formed a base around the 1.3400-1.3450 area, indicating that selling pressure is waning and buyers are beginning to step in. This compression and failure to break lower suggest that a bullish reversal may be imminent.
Identification of the Key Support Zone
The most critical technical element is the Strong Support Zone between approximately 1.34050 and 1.33500.
The strength of this zone is derived from:
- Historical Significance: This level has acted as a major swing low and consolidation area on multiple occasions throughout October and November, as clearly marked on the chart.
- Technical Confluence: The zone aligns with a key psychological level (1.3400) and represents the lower boundary of the recent multi-month trading range.
- Market Psychology: This area represents a point where sellers have repeatedly failed to push the price lower, leading to potential buyer exhaustion and a sentiment shift towards accumulation.
This confluence makes it a high-probability level for a bullish reaction.
Technical Targets and Rationale
Our analysis identifies the following price targets:
Primary Target (PT1): 1.35910
This level represents a previous significant swing high and a key resistance level. A break above this zone would confirm strengthening bullish momentum and could open the path for a larger reversal.
Intermediate Target (PT2): 1.35280
This acts as an initial resistance level and a logical first profit-taking area on the way to PT1. It is a prior level where price has previously reacted.
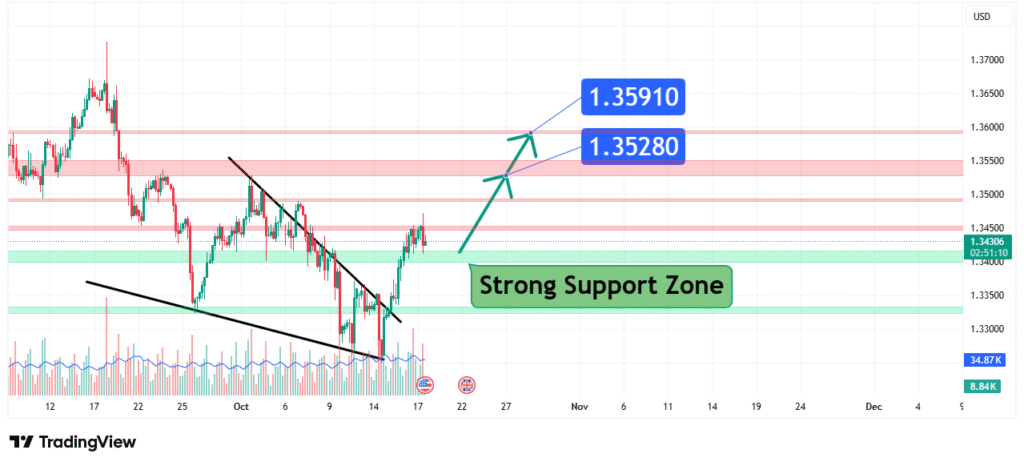
Prediction: We forecast that the price will rally from the current support zone, first testing the intermediate resistance at 1.35280. A sustained bullish move above that level would then open the path towards our primary target at 1.35910.
Risk Management Considerations
A professional strategy is defined by its risk management.
- Invalidation Level (Stop-Loss): The entire bullish reversal thesis is invalidated if the price achieves a daily close below the strong support zone, specifically below 1.33500. This level represents a clear break of the foundational support that the bullish bounce is predicated upon.
- Position Sizing: Any long positions taken should be sized so that a loss triggered at the invalidation level represents a small, pre-defined percentage of your total capital (e.g., 1-2%).
Fundamental Backdrop
The technical setup is framed by the current fundamental landscape:
- Factor 1: The monetary policy divergence between the Bank of England (BoE) and the Federal Reserve remains a key driver. Hawkish signals from either central bank will cause significant volatility.
- Factor 2: UK economic data, particularly inflation (CPI) and GDP figures, will be critical in shaping expectations for the BoE’s future policy path.
- Factor 3: Broad US Dollar (USD) strength or weakness, often driven by US economic data and risk sentiment, is a primary force for this pair.
These factors currently contribute to a cautiously bullish sentiment for a short-term rebound, though the longer-term trend will depend on upcoming economic developments.
Conclusion
GBP/USD is testing a critical technical support zone that has held firm on multiple occasions. The weight of evidence suggests a bullish resolution in the form of a corrective rally, initially targeting 1.35280 and ultimately 1.35910. Traders should monitor for confirmed bullish reversal patterns as price interacts with this support and manage risk diligently by respecting the key invalidation level below 1.33500.
Chart Source: TradingView
Disclaimer: This analysis is for informational and educational purposes only and does not constitute financial advice or a recommendation to buy or sell any security. All trading and investing involves significant risk, including the possible loss of your entire investment. Always conduct your own research (DYOR) and consider seeking advice from an independent financial professional before making any trading decisions.
