GBPUSD Price Forecast Eyeing a Drop to 1.3300 and 1.3350
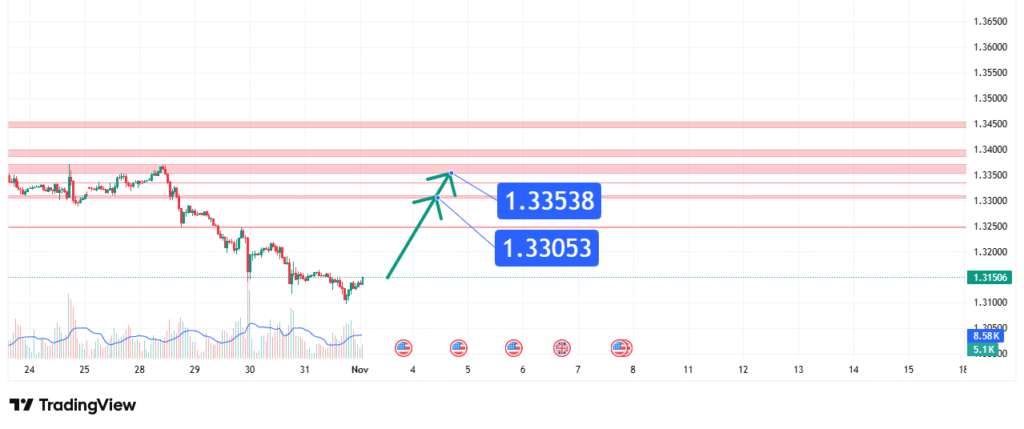
GBP/USD’s price has broken down from a consolidation range and has faced sustained selling pressure, decisively moving below the 1.3350 support area. This price action suggests a bearish bias is firmly in control. Our analysis projects a continuation of the downtrend towards primary targets of 1.3300 and 1.3350. This prediction is based on a confluence of technical factors, including the breakdown of a key support level and the establishment of a lower high market structure.
Current Market Structure and Price Action
The current market structure is bearish, characterized by a clear sequence of lower highs and lower lows. The price has recently broken below the significant support level at 1.3350, which has now turned into a new resistance. Recent price action shows a consolidation around the 1.3350-1.3400 zone that has resolved to the downside, indicating a breakdown and a resumption of the prevailing bearish trend. The pair is now trading near 1.3150, testing the next layer of downside support.
Identification of the Key Resistance Zone
The most critical technical element for this bearish setup is the Strong Resistance Zone between 1.3350 and 1.3400. The strength of this zone is derived from:
- Historical Significance: This level acted as a major support floor throughout late October and early November. The principle of “support turns into resistance” makes this a critical area for any bullish recovery attempts.
- Technical Confluence: The zone aligns with the recent breakdown point and the psychological round number of 1.3400, adding to its technical importance.
- Market Psychology: This area now represents a point where sellers who missed the initial breakdown are likely to re-enter, and buyers who held through the drop may look to exit, creating a supply zone.
This confluence makes it a high-probability level for a bearish reaction, capping any corrective bounces.
Technical Targets and Rationale
Our analysis identifies the following descending price targets:
Primary Target (PT1): 1.3300
This level represents the immediate measured move target based on the height of the recent consolidation range projected downward from the breakdown point. It is also a key psychological level.
Secondary Target (PT2): 1.3250
This acts as a more significant support level, coinciding with the lows seen in late October. A break below PT1 would likely see momentum carry the price down to test this zone.

Prediction: We forecast that the price will continue its descent from current levels, moving towards PT1 at 1.3300. A sustained bearish momentum below that would then open the path towards PT2 at 1.3250.
Risk Management Considerations
A professional strategy is defined by its risk management.
- Invalidation Level (Stop-Loss): The entire bearish thesis is invalidated if the price achieves a daily close above the key resistance zone, specifically at 1.3420. This level represents a clear break of the newly established lower high structure and a reclaim of the former support-turned-resistance zone.
- Position Sizing: Any short positions should be sized so that a loss triggered at the 1.3420 invalidation level represents a small, pre-defined percentage of your total capital (e.g., 1-2%).
Fundamental Backdrop
The technical setup is framed by the current fundamental landscape:
- Diverging Central Bank Policies: The market perception of a more hawkish Federal Reserve relative to the Bank of England is a key driver, strengthening the US Dollar against the Pound.
- UK Economic Concerns: Persistent worries about the UK’s economic growth outlook and fiscal sustainability continue to weigh on Sterling sentiment.
- Risk Sentiment: A “risk-off” environment in global markets tends to benefit the US Dollar as a safe-haven currency, adding downward pressure on GBP/USD.
These factors contribute to the bearish sentiment surrounding the pair, providing a fundamental rationale for our technical forecast.
Conclusion
GBP/USD has breached a critical support level, confirming a bearish breakdown. The weight of evidence suggests a continuation of the bearish trend, targeting a move first to 1.3300 and potentially extending towards 1.3250. Traders should monitor for any pullbacks to the 1.3350-1.3400 resistance zone as potential selling opportunities and manage risk diligently by respecting the key invalidation level at 1.3420. The reaction at the target support zones will be crucial for determining the next major directional move.
Chart Source: TradingView
Disclaimer: This analysis is for informational and educational purposes only and does not constitute financial advice or a recommendation to buy or sell any security. All trading and investing involves significant risk, including the possible loss of your entire investment. Always conduct your own research (DYOR) and consider seeking advice from an independent financial professional before making any trading decisions.


