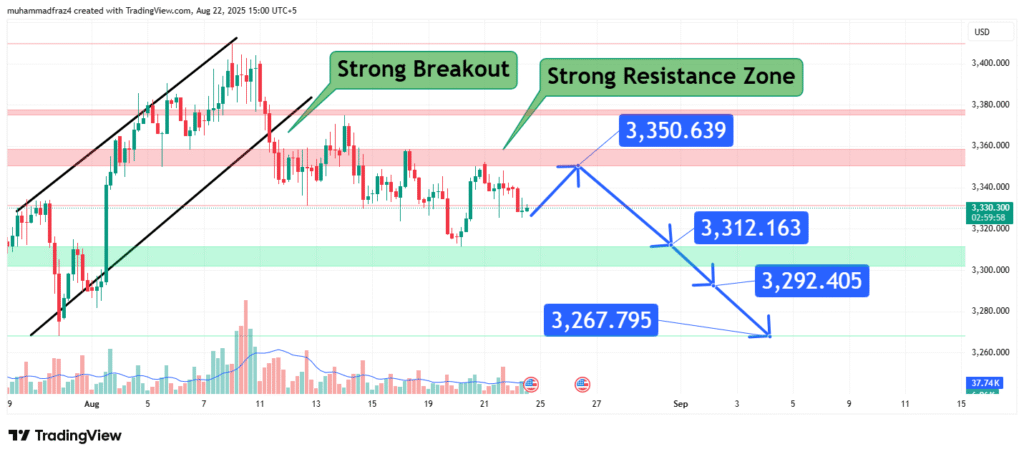
Gold Achieves Strong Breakout, Targets $3,350 as Resistance Turns to Support
The gold market has delivered a significant technical event, clearly denoted on the chart as a “Strong Breakout.” This move represents a decisive victory for the bulls, as the price has pushed through and closed above a previously formidable “Strong Resistance Zone.” Such breakouts are critical in technical analysis as they indicate a fundamental shift in market sentiment, where previous ceilings of selling pressure become new floors of buying support. This article will deconstruct the anatomy of this breakout, explain the significance of the former resistance levels, and provide a detailed projection for the next likely upside targets in this newly confirmed bullish phase.
The Significance of the Breakout and the Resistance Zone
The resistance zone, comprised of the levels $3,297.795, $3,312.163, and $3,350.639, acted as a significant barrier that likely capped multiple rally attempts in the past. Each test of this zone represented a concentration of selling interest. The fact that price has now cleanly broken above this entire cluster is a powerful bullish signal. It suggests that buying demand has finally absorbed all available supply at these levels. Furthermore, a robust breakout is often accompanied by increasing volume—a key factor that validates the move’s sustainability. According to the principle of role reversal, this former resistance zone is now expected to transform into a strong support basin. Any future pullbacks into this range (approximately $3,297 – $3,350) should now be viewed as potential buying opportunities within the larger bullish trend, as buyers are expected to defend this newly conquered territory.
Price Projection and Upside Targets
Following a confirmed breakout from a significant resistance area, technical analysts often project targets by measuring the prior range or applying Fibonacci extension levels. Based on these common methodologies, the breakout sets a clear path toward higher valuations. The provided targets are logical projections for the next stages of the advance:

- Initial Target: $3,292 USD: This level may act as the first psychological hurdle and a minor resistance point on the way higher.
- Secondary Target: $3,312 USD: This aligns directly with one of the previous resistance levels within the conquered zone. A break above it confirms strength.
- Tertiary Target: $3,350 USD: This is a primary target and represents the upper boundary of the former resistance zone. reclaiming this level definitively would be an exceptionally strong sign and open the path to uncharted territory.
A sustained move above $3,350 would indicate that the bullish momentum is exceptionally powerful and could lead to a continued parabolic advance.
Conclusion
In conclusion, the technical picture for Gold is overwhelmingly bullish following its strong breakout. The transformation of a major resistance zone into a new support base provides a solid foundation for further gains. The projected path higher toward $3,292, $3,312, and ultimately $3,350 is well-defined. Traders should adopt a “buy the dip” strategy, with any retest of the $3,297-$3,350 support zone representing an attractive entry point. The bullish thesis would be invalidated only if the price were to fall back significantly below the $3,297 support level, which would suggest the breakout was false. For now, the momentum favors the bulls, and higher prices are the path of least resistance.
Chart Source: TradingView
Disclaimer: This analysis is based on technical patterns and is for informational purposes only. It does not constitute financial advice. Trading precious metals involves significant risk, and you should conduct your own research before making any investment decisions.
How did this post make you feel?
Thanks for your reaction!


