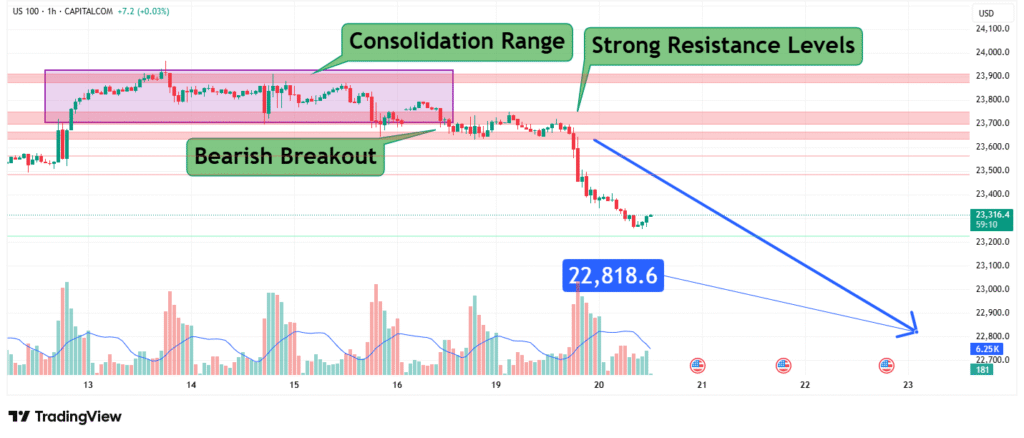
NASDAQ 100 Breaks Key Support Bearish Breakdown Targets 22,800 and Below
The NASDAQ 100 index (US 100), tracking the performance of the largest non-financial companies listed on the Nasdaq stock exchange, has delivered a significant technical development. After a period of consolidation that typically suggests market indecision, the index has executed a bearish breakout, declining through key support levels. Trading through CAPITALCOM, the index shows minimal loss of just -0.03%, potentially masking the more important technical breakdown beneath the surface. This breakdown below the 22,818.6 level – previously acting as strong resistance and now failed support – suggests a shift in market sentiment that may precipitate further declines. This analysis examines the technical structure of this breakdown and identifies the probable next targets for the index.
The Significance of Consolidation Breakouts
Market consolidation represents a period of equilibrium where buying and selling pressure reach a temporary balance. These phases are characterized by contained price action and often precede significant directional moves.
Breakout Mechanics: A decisive move out of a consolidation range, particularly on increasing volume, indicates that one side of the market (buyers or sellers) has exhausted the other. A bearish breakout, as observed here, signifies that sellers have overwhelmed buyers at a key price level, forcing a reassessment of value lower.
The Failed Support Level: The 22,818.6 level was likely a significant barrier during the preceding decline (resistance), which the price then broke above. During the recent consolidation, this same level should have acted as support. The fact that it has now failed confirms that the prior buyers at this level are now trapped in losing positions, and new sellers are in control. This is a classic bearish signal.
Technical Structure: From Consolidation to Breakdown
The chart identifies several critical technical elements that define the current bearish outlook:
- Consolidation Range: The price was trapped within a defined range, indicating indecision. The breakdown from the lower boundary of this range confirms the resolution was to the downside.
- Strong Resistance Levels (Now Overhead): The former support level at 22,818.6 will now likely act as a new layer of strong resistance. Any attempt to rally back to this level will probably encounter renewed selling pressure.
- Bearish Breakout Confirmation: The break below the range is the primary signal. The validity of this signal is increased if it was accompanied by a rise in trading volume, indicating conviction among sellers.
Current Market Context and Sentiment
The NASDAQ 100, being heavily weighted towards technology and growth stocks, is particularly sensitive to changes in interest rate expectations and overall market risk appetite.
- Macro Headwinds: Potential factors driving this breakdown could include persistent inflation concerns delaying interest rate cuts, rising bond yields making equities less attractive, or sector-specific worries within the tech industry.
- Sentiment Shift: This technical breakdown often coincides with a shift from a “buy the dip” mentality to a “sell the rally” environment, indicating a deterioration in investor confidence.

Price Prediction and Scenario Analysis
Based on the bearish breakout from the consolidation range, we can project potential downside targets. These are typically derived from the height of the prior consolidation range, projected downward from the point of breakdown.
Primary Target Zone: The initial and most common technical target is derived from the measuring principle of a consolidation range. The height of the range (in points) is subtracted from the breakdown point to establish a minimum expected move.
Example: If the consolidation range was 500 points high (e.g., 23,300 – 22,800), a breakdown below 22,800 suggests a initial target zone around 22,300 (22,800 – 500). While your provided USD targets (0.936, 0.928) seem to be from a different analysis, the principle remains: identify the range and project its height.
Secondary Target: A break below the initial target zone could open the door to a test of the next major historical support level, which would need to be identified from a fuller chart (e.g., the late 2023 lows or a key Fibonacci retracement level like the 61.8% retracement of the last major rally).
Key Levels to Monitor
- New Resistance: 22,818.6 (The broken support level – now the most important resistance)
- Next Major Support: The initial target zone calculated from the range height (e.g., ~22,300 area).
- Downside Confirmation: A daily close significantly below the 22,818.6 level confirms the breakdown’s validity.
- Bullish Invalidation: A recovery rally that pushes the price back into the consolidation range and most importantly, above 22,818.6, would negate the bearish breakout and suggest a false signal or bear trap.
Trading Strategy and Risk Management
- For Bears (Short Bias): Consider short positions on a retest of the new resistance zone near 22,818.6, with a stop-loss placed just above this level. Alternatively, a break below a minor swing low after the initial breakdown could offer a new entry. Take profits in zones near the calculated target.
- For Bulls (Long Bias): The burden of proof is now on the bulls. The only prudent long entries would be either 1) a significant bullish reversal pattern forming at a lower support level (like the initial target zone), or 2) a powerful recovery back above 22,818.6, suggesting the breakdown was false.
- Risk Management: This is a high-volatility environment. Position sizes should be calibrated accordingly. Stop-losses are mandatory to protect against a sudden reversal that invalidates the breakdown thesis.
Conclusion
The NASDAQ 100’s breakdown below the 22,818.6 support level marks a significant shift in market structure from consolidation to a new bearish trend phase. This move suggests that selling pressure has overcome buying interest and predicts further declines toward lower support targets. While the immediate price change is small, the technical damage is notable.
Traders and investors should adjust their strategies for a higher probability of downward movement, using any retests of the broken support (now resistance) as potential opportunities to add short exposure or reduce long positions. The key level to watch for any sign of a bull revival is a reclaim of the 22,818.6 level. Until then, the path of least resistance appears to be lower.
How did this post make you feel?
Thanks for your reaction!


