Natural Gas Price Analysis Bullish Momentum Builds Toward Key Resistance Levels
Natural gas prices are showing renewed bullish momentum as traders eye higher resistance levels in the short term. The 1-hour chart for XNG/USD highlights a well-defined market structure, with price action consolidating above a strong support zone. This technical setup suggests that buyers are positioning for another leg upward, potentially breaking into new short-term highs if resistance levels are breached.
Current Price Overview
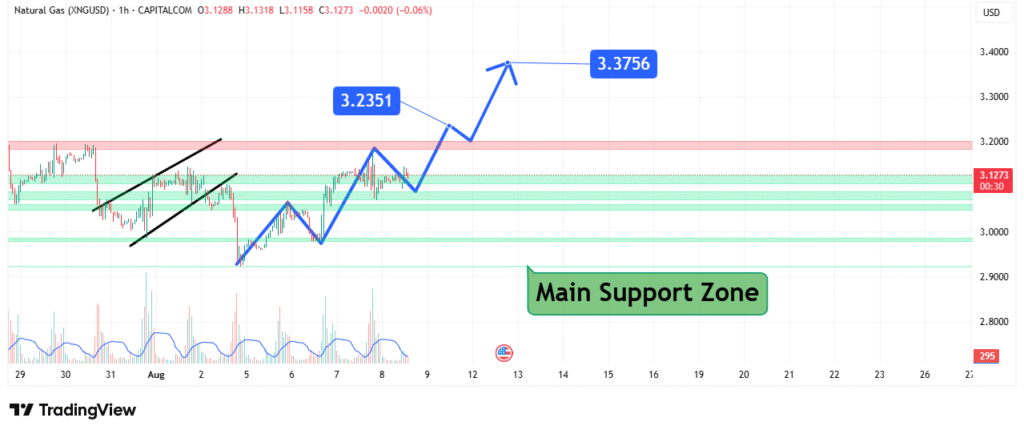
At the time of analysis, Natural Gas is trading at $3.127, holding steady above the main support zone marked on the chart in green. This zone has repeatedly acted as a safety net for buyers, preventing deeper declines and absorbing selling pressure. The stability around this area underscores its importance as the base of the current bullish structure.
Market Structure and Recent Price Action
In late July and early August, the market formed a rising wedge pattern, which led to a short-term bearish correction. This drop took prices back into the support zone, where buyers regained control.
Following this rebound, the price action developed a series of higher highs and higher lows—a classic bullish indicator. The breakout from intermediate resistance has reinforced the uptrend, with traders now focusing on the next key levels above.
Key Resistance Levels to Watch
Two critical upside targets are now in focus:
- $3.2351 – The first major breakout point above the current trading range.
- $3.3756 – The next resistance zone if bullish momentum continues.
A strong breakout above $3.2351 with increased trading volume could pave the way for a quick move toward $3.3756.
Supply Zone Challenges
The red zone above $3.20 represents a previously tested supply area where sellers have stepped in before. For buyers to maintain momentum, they must break through this area with conviction. Failure to do so could see prices temporarily stall or retrace toward the green support zone.
Downside Risk and Support Levels
While the technical outlook is bullish, traders should watch the downside closely:
- A break below the main support zone could trigger a decline toward $3.00.
- Further weakness might open the door to a retest near $2.90.
As long as the support zone holds, however, the probability of an upward breakout remains higher.
Technical Outlook
- Trend Bias: Bullish
- Immediate Support: $3.10 – $3.00 zone
- Key Resistance Levels: $3.2351 and $3.3756
- Pattern in Play: Higher highs & higher lows after wedge breakdown recovery
Conclusion
Natural gas prices are currently in a favorable technical position, with buyers maintaining control above a critical support zone. The next few sessions will be crucial, as a break above $3.2351 could trigger a rally toward $3.3756. While downside risks remain if support fails, the overall chart structure leans bullish, suggesting that upward momentum could dominate the short-term outlook.
