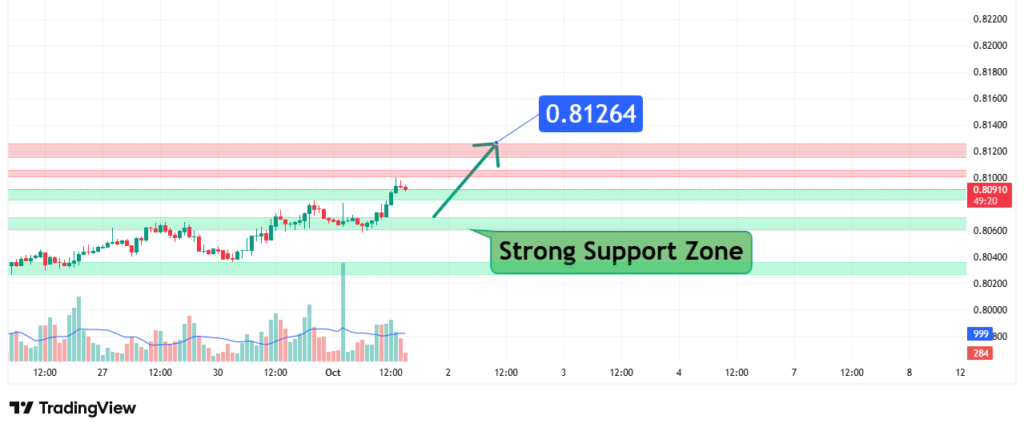
NZDCAD Price Analysis Bullish Reversal Targets 0.8120
NZDCAD’s price has been in a sustained downtrend but is now consolidating around a critical historical support zone between 0.8060 and 0.8090. This price action suggests a potential bullish reversal is forming as sellers exhaust themselves. Our analysis projects a corrective bounce towards a primary target of 0.8120. This prediction is based on a confluence of technical factors, including a strong multi-touch support zone and bullish divergence signals on lower timeframes.
Current Market Structure and Price Action
The broader market structure for NZDCAD is bearish, characterized by a series of lower highs and lower lows. However, the price has now entered a region of significant historical buying pressure. The current consolidation just above the 0.8090 level, after a sharp decline, indicates a potential slowdown in selling momentum. The formation of small-bodied candles and potential bullish pin bars in this zone suggests that a short-term bullish reversal or a significant pullback is increasingly probable.
Identification of the Key Support Zone
The most critical technical element is the Strong Support Zone between 0.8060 and 0.8090. The strength of this zone is derived from:
- Historical Significance: This level has acted as a major swing low and consolidation area on multiple previous occasions, as clearly marked on the provided chart. Each touch has resulted in a notable bounce, reinforcing its importance.
- Technical Confluence: The zone aligns with the recent low of 0.80910 and the psychological level of 0.8100, adding to its strength.
- Market Psychology: This area represents a point where sellers are likely to take profits and value-seeking buyers are expected to enter the market, creating a potential imbalance in favor of the bulls.
This multi-faceted confluence makes it a high-probability level for a bullish reaction.
Technical Target and Rationale
Our analysis identifies the following price target:
Primary Target: 0.8120 USD
This level represents the most immediate and significant resistance. It is a previous support level that has now turned into resistance and aligns with the recent consolidation breakdown point. A move to this level would constitute a typical retest of broken support from beneath, a common price action phenomenon.

Prediction: We forecast that the price will bounce from the current support zone and move towards our PT1 at 0.8120. A sustained break above this level would be required to signal a stronger recovery.
Risk Management Considerations
A professional strategy is defined by its risk management.
- Invalidation Level (Stop-Loss): The entire bullish thesis is invalidated if the price achieves a decisive daily close below the strong support zone, specifically below 0.8060. This level represents the final defense for the bulls; a break below it would signal a continuation of the underlying bearish trend and likely trigger a further decline towards 0.8000.
- Position Sizing: Any long positions taken should be sized so that a loss triggered at the 0.8060 invalidation level represents a small, pre-defined percentage of your total capital (e.g., 1-2%).
Fundamental Backdrop
The technical setup is framed by the current fundamental landscape:
- Commodity Correlation: Both the NZD and CAD are commodity-linked currencies. The pair’s direction will be sensitive to shifts in global risk sentiment and the relative performance of key exports like dairy (NZD) and oil (CAD).
- Central Bank Policy: The monetary policy outlook from the Reserve Bank of New Zealand (RBNZ) and the Bank of Canada (BoC) is a key driver. Any hawkish signals from the RBNZ relative to the BoC could provide fundamental tailwinds for this bullish technical setup.
- Global Economic Data: Upcoming economic data from China, a major trading partner for both nations, can cause volatility in the pair.
Conclusion
NZDCAD is at a technical inflection point, testing a robust historical support zone. The weight of evidence suggests a potential bullish reversal is brewing, targeting a move to 0.8120. Traders should monitor for confirmed bullish reversal patterns (e.g., bullish engulfing, morning star) on the lower timeframes as a trigger for entry and manage risk diligently by respecting the key invalidation level at 0.8060. The reaction at the 0.8120 target will be crucial for determining if this is merely a pullback or the start of a larger reversal.
Chart Source: TradingView
Disclaimer: This analysis is for informational and educational purposes only and does not constitute financial advice or a recommendation to buy or sell any security. All trading and investing involves significant risk, including the possible loss of your entire investment. Always conduct your own research (DYOR) and consider seeking advice from an independent financial professional before making any trading decisions.


