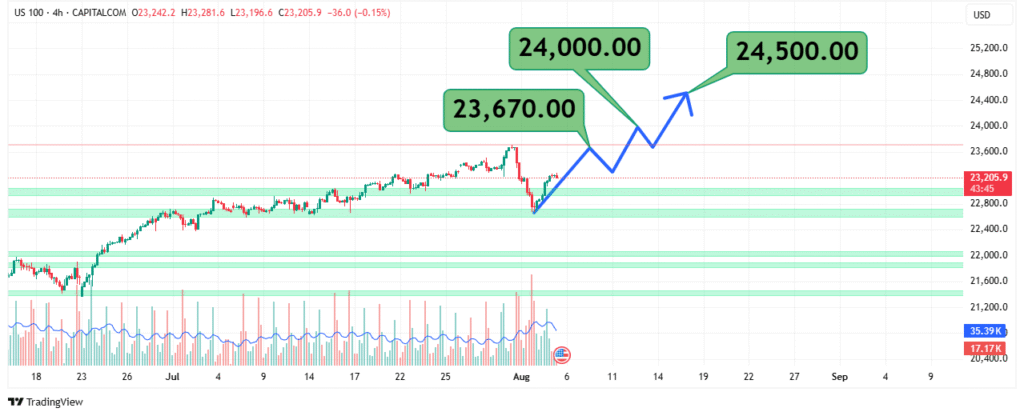
US100 Technical Analysis - Key Levels and Trading Outlook
Market Overview
The US100 (Nasdaq 100) is currently trading at 23,205.9, down 0.15% in the 4-hour session, with prices fluctuating between 23,196.6 and 23,281.6. The index is consolidating near a critical support-resistance zone, suggesting a potential breakout or reversal in the coming sessions.
Key Technical Observations
1. Price Structure & Trend
- Immediate Resistance: 23,670.00 (Recent swing high)
- Key Support: 23,000.00 (Psychological level)
- Higher Timeframe Resistance: 24,000.00 (Major hurdle for bulls)
- The price is trapped in a tight range (23,200–23,670), indicating indecision.
2. Moving Averages (Trend Confirmation)
- 50 EMA: Acting as dynamic resistance near 23,500.
- 200 EMA: Long-term support at 22,800.
- A break above the 50 EMA could signal short-term bullish momentum.
3. Momentum Indicators
- RSI (14): Neutral (~45–50), no clear overbought/oversold signal.
- MACD: Flat near the zero line, suggesting consolidation.
Trading Strategies
Bullish Scenario (Breakout Trade)
- Trigger: A decisive 4-hour close above 23,670 with rising volume.
- Targets:
- 24,000.00 (Psychological resistance).
- 24,400.00 (Next supply zone).
- Stop-Loss: Below 23,000.00 (Key support).

Bearish Scenario (Breakdown Trade)
- Trigger: A drop below 23,000.00 with increasing selling pressure.
- Targets:
- 22,800.00 (200 EMA support).
- 22,400.00 (Next demand zone).
- Stop-Loss: Above 23,500.00 (50 EMA resistance).
Key Levels to Watch
| Resistance | Support |
|---|---|
| 23,670.00 | 23,000.00 |
| 24,000.00 | 22,800.00 |
| 24,400.00 | 22,400.00 |
Final Verdict
The US100 is at a critical juncture, with the 23,000–23,670 range dictating the next major move. Traders should wait for a confirmed breakout or breakdown before taking positions.


