USDCAD Price Analysis Triple Bottom Hints at Strong Bullish Reversal
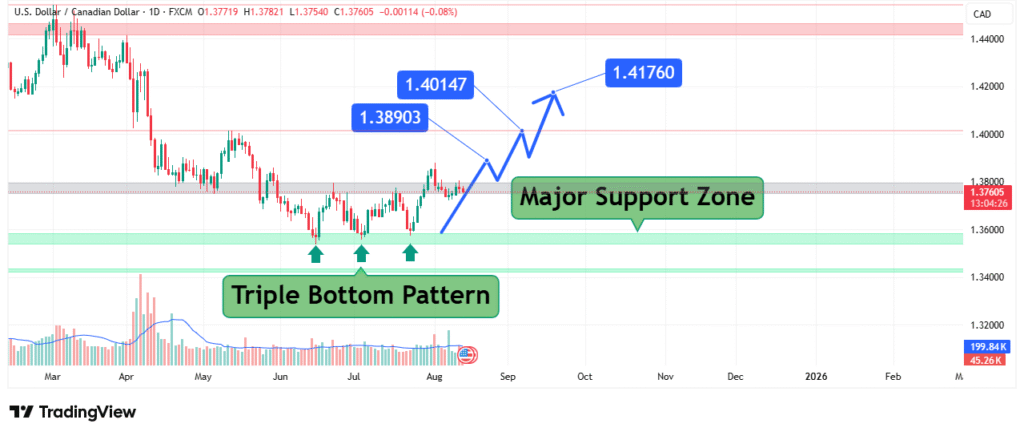
The USD/CAD currency pair is showing a strong technical setup that could mark the beginning of a medium-term bullish reversal. A triple bottom pattern has formed on the daily chart, coinciding with a well-defined major support zone between 1.3500 and 1.3600. This pattern, combined with price action, volume behavior, and key resistance levels ahead, suggests that buyers may soon drive the pair towards 1.3800, 1.4000, and 1.4100.
Triple Bottom Formation at Major Support
The triple bottom is a classic bullish reversal pattern that forms after a prolonged downtrend. It occurs when price tests the same support level three times without breaking lower, indicating that selling pressure is weakening while buying interest grows stronger.
In the case of USD/CAD, the support zone between 1.3500 and 1.3600 has been tested in June, July, and early August. Each test saw strong rejection wicks and rising buy volume, signaling that institutional and large-scale traders are defending this level aggressively.
This repeated defense of support confirms that the market views this zone as a fair value for USD against CAD in the current macroeconomic environment.
Price Action and Current Market Structure
Following the third bounce from the major support zone, USD/CAD has been climbing steadily, breaking minor resistance levels and showing bullish momentum. The pair is now consolidating just below 1.3800, which is the first significant resistance barrier in this upward move.
- Immediate Support: 1.3700 – 1.3720
- Major Support: 1.3500 – 1.3600
- Immediate Resistance: 1.3800
- Next Resistance Levels: 1.3890, 1.4015, 1.4176
The structure is shifting from a downtrend to a potential uptrend, with higher lows forming after each bounce. This shift in market structure strengthens the bullish case.
Volume analysis supports the bullish outlook. During each rally from the support zone, volume spikes have been observed, showing that buyers are entering with conviction.
The Relative Strength Index (RSI) on the daily chart is moving upward but remains below overbought levels, which suggests that the pair still has room to run before hitting extreme conditions.
The Moving Average Convergence Divergence (MACD) has crossed into positive territory, with the MACD line above the signal line, a sign of strengthening bullish momentum.
Upside Targets
If buyers successfully break above the 1.3800 resistance, the next targets will be:

- 1.3890 – Previous swing high and minor resistance area where some profit-taking may occur.
- 1.4015 – Key psychological and technical resistance; a breakout above this would confirm a medium-term bullish trend.
- 1.4176 – Long-term resistance zone and potential final target for this rally.
The projected move aligns with the measured height of the triple bottom pattern, which often produces rallies equal to the distance between the pattern’s support and neckline.
Bearish Scenario – What Could Invalidate the Setup
While the technical picture is bullish, traders should remain cautious. A daily close below 1.3700 would be the first warning sign of weakening momentum. If price breaks and sustains below 1.3500, the triple bottom pattern would be invalidated, potentially resuming the broader downtrend towards 1.3300.
Conclusion
USD/CAD is showing a strong bullish reversal setup with a triple bottom at a major support zone. Volume, momentum indicators, and market structure all support a move higher towards 1.3800, 1.4000, and 1.4100. Traders should monitor the 1.3800 resistance closely, as a confirmed breakout could trigger a strong upward extension.
In short, the technical landscape favors the bulls, but the key lies in holding above the major support and breaking through near-term resistance levels.


