EURJPY at a Pivotal Juncture Resistance Zone Holds the Key to Next Move
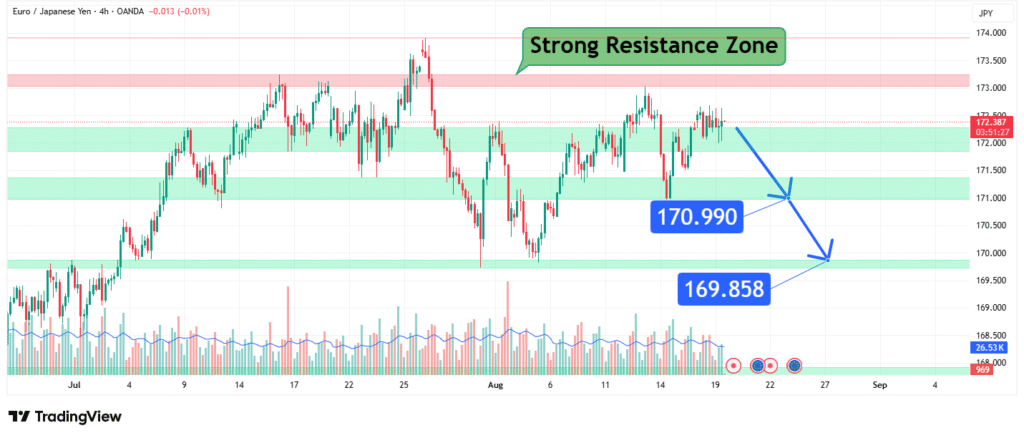
The Euro versus Japanese Yen (EUR/JPY) cross is currently engaged in a critical technical battle on its 4-hour chart. After a notable rally, the pair has advanced into a defined strong resistance zone between 169.858 and 170.990. This area represents a major hurdle that will dictate the pair’s short-to-medium-term trajectory. The current price action shows indecision, with the pair posting minimal losses but struggling to find the momentum for a clear breakout. This analysis breaks down the technical structure and presents a dual-path prediction with targets at 170.9 on a breakout and 169.8 on a rejection.
The Significance of the 169.858 – 170.990 Resistance Zone
The resistance zone identified on the chart is a formidable barrier due to several converging technical factors:
- Recent Swing Highs: The upper boundary of this zone, near 170.990, likely represents a recent multi-session high where previous upward moves have faltered. These peaks create a ceiling where selling interest has historically emerged.
- Psychological and Technical Confluence: Resistance zones are rarely single points. The range between 169.858 and 170.990 acts as a band where sell orders, profit-taking, and technical indicators align. It may also confluence with key Fibonacci retracement levels or moving averages not visible in the snippet.
- Market Memory: Price levels where significant reversals or consolidations have previously occurred become ingrained in trader psychology, making them future points of interest.
Current Market Context and Price Action
Trading through OANDA, the pair is showing faint bearish pressure, down a marginal 0.01%. This minuscule move, right at the resistance zone, is classic consolidation behavior. The price is essentially pausing to absorb the selling pressure and build energy for its next significant move. The narrow range and low volatility indicate a equilibrium that is likely to be broken with a surge in momentum.
Dual-Path Price Prediction and Scenario Analysis
The proximity to this key resistance creates two high-probability scenarios for traders to monitor.

Scenario 1: Bullish Breakout (Target: 170.900)
- Trigger: A sustained 4-hour close above the resistance zone, particularly a break and hold above 170.990, confirmed by strong bullish momentum and increasing volume.
- Rationale: A breakout would signal that bullish momentum has overwhelmed all available supply at this level. This could be driven by a continued weakening of the Japanese Yen (JPY) due to the Bank of Japan’s dovish stance or a surge in Euro (EUR) strength from hawkish European Central Bank rhetoric.
- Target: The initial bullish target would be a retest and extension beyond the recent high. The 170.900 level serves as a primary initial target within the upper portion of the resistance band, acting as a stepping stone towards new higher highs.
Scenario 2: Bearish Rejection (Target: 169.800)
- Trigger: A clear rejection from the resistance zone, evidenced by a bearish reversal candlestick pattern (such as a bearish engulfing or a double top) followed by a drop below the immediate support levels.
- Rationale: This would confirm that the resistance zone remains structurally intact. Traders are continuing to sell into strength, and the bullish trend requires a longer period of consolidation or a deeper pullback to gather renewed buying interest.
- Target: A rejection from current levels would open the path for a decline toward the 169.800 level. This price point, marking the lower boundary of the current resistance zone, would be the first major line of defense for bulls. A break below it could trigger a deeper correction towards 169.000 or lower.
Key Levels to Monitor
- Resistance: 169.858 – 170.990 (The Strong Resistance Zone)
- Upper Target (Bullish): 170.900 (Within the resistance break)
- Lower Target (Bearish): 169.800 (Lower boundary of the resistance zone for a pullback)
- Next Major Support: 169.000 (Key level below the target for an extended move down)
Trading Strategy and Risk Management
Navigating this environment requires patience and discipline.
- For Bulls: Aggressive traders might anticipate a breakout, but a prudent strategy is to wait for a confirmed close above 170.990 before entering long. A stop-loss should be placed below a recent swing low within the consolidation.
- For Bears: A short position can be considered on a clear rejection signal at the resistance, with an initial profit target at 169.800. A stop-loss would be essential above the recent high (170.990).
- Risk Management: The 4-hour timeframe suggests shorter-term trades. Position sizes should be calibrated to the higher volatility of this pair, ensuring stop-losses are placed at logical levels to avoid being taken out by normal market noise.
Conclusion
The EUR/JPY pair is at a technical inflection point, compressed within a strong resistance zone between 169.858 and 170.990. The market is presenting a clear dichotomy: a breakout above this ceiling could propel the pair towards 170.9 and beyond, while a rejection could initiate a corrective decline targeting 169.8. Traders should adopt a patient, reactionary approach, waiting for the market to show its hand with a decisive breakout or reversal pattern before committing to a direction. As always, strict risk management is paramount when trading at such critical technical levels.
How did this post make you feel?
Thanks for your reaction!


