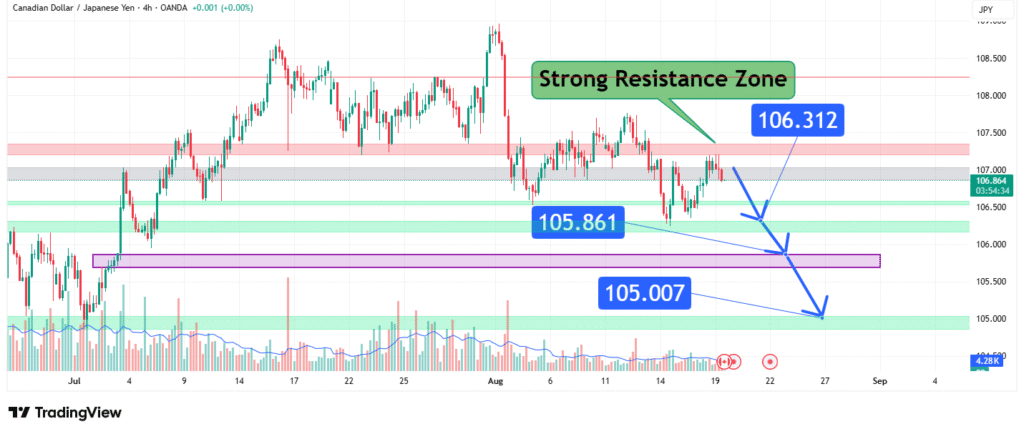
CADJPY Technical Playbook Trading the 105.0 - 105.86 Resistance Barrier
The Canadian Dollar versus Japanese Yen (CAD/JPY) pair is currently at a decisive technical juncture. The price action has advanced into a densely contested area marked as a strong resistance zone, bounded by the key levels of 105.007 and 105.861. This zone represents a critical battlefield where the forces of bullish momentum and bearish defense will clash to determine the next sustained directional move. This analysis deconstructs this pivotal setup, outlining the technical rationale and presenting a structured trading plan with clear bullish and bearish targets at 106.3, 105.8, and 105.0.
Dissecting the Strong Resistance Zone (105.007 – 105.861)
The “Strong Resistance Zone” label on the chart is not arbitrary; it signifies a price band where multiple forms of selling pressure converge, creating a significant barrier for further gains.
- Technical Confluence: This zone likely represents a fusion of several technical factors. It may include a key Fibonacci retracement level (e.g., the 61.8% or 78.6% retrace of a previous decline), a long-term moving average (e.g., the 200-period), or the neckline of a previous bearish pattern. The cluster of these elements within a tight band strengthens its significance.
- Historical Price Action: The levels at 105.007 and 105.861 have almost certainly acted as significant swing highs or lows in the recent past. These areas become “market memory” points where traders who missed previous exits look to sell, and new speculative shorts are initiated.
- Psychological Pressure: Round numbers and their proximities (like 105.000 and 106.000) often act as psychological magnets for orders. This zone encapsulates the approach to such a key figure.
Current Market Context and Sentiment
The pair’s approach into this zone suggests a period of strengthening momentum, likely driven by a combination of rising crude oil prices (bolstering the commodity-linked CAD) and a prevailing risk-on sentiment in markets (weakening the safe-haven JPY). However, the advance is now meeting its most significant test yet. The price action within this zone will reveal whether the underlying bullish sentiment is strong enough to absorb all available supply or if it is becoming exhausted.
Multi-Tiered Price Prediction and Scenario Analysis
Given the clear definition of this resistance barrier, we can outline two primary scenarios with precise levels for entry, stop-loss, and profit-taking.

Scenario 1: Bullish Breakout (Targets: 105.800 & 106.300)
- Trigger: A sustained daily close above the upper boundary of the resistance zone at 105.861. This should be confirmed by a strong bullish candle and ideally, an increase in trading volume.
- Rationale: A break above this confluence of resistance would be a powerful technical signal, indicating that buying pressure has completely overwhelmed selling interest. It would likely trigger a wave of momentum buying and short covering.
- Targets:
- First Target (T1): 105.800. This level, just above the breakout point, acts as an immediate target and a area to secure partial profits.
- Primary Target (T2): 106.300. This represents a measured move target (e.g., the height of the previous consolidation added to the breakout point) or a previous significant high. This is the main objective of the breakout move.
Scenario 2: Bearish Rejection (Target: 105.000)
- Trigger: A clear rejection from within the resistance zone, evidenced by a bearish reversal candlestick pattern (such as a bearish engulfing, shooting star, or double top) followed by a drop back below 105.500.
- Rationale: This would confirm that the resistance zone remains structurally valid. It signifies that sellers are aggressively defending this area, leading to a “risk-off” pullback where traders take profits on long CAD/JPY positions.
- Target:
- Primary Target: 105.000. A rejection would open the path for a decline toward the major psychological support at 105.000. This level also represents the lower boundary of the resistance zone, completing a full retest of the area from below.
Key Levels to Monitor
- Resistance: 105.007 – 105.861 (The Strong Resistance Zone)
- Breakout Trigger: > 105.861 (Sustained close)
- Bullish Targets: 105.800 (T1), 106.300 (T2)
- Bearish Trigger: Rejection pattern at current zone
- Bearish Target: 105.000
- Next Major Support (below target): 104.500
Trading Strategy and Risk Management
A disciplined, reaction-based approach is essential.
- For Bulls: Wait for the confirmed breakout above 105.861 before entering long. A stop-loss should be placed just below the resistance zone (e.g., 105.000) to protect against a false breakout. Take partial profits at 105.800 and trail the stop for the remainder toward 106.300.
- For Bears: Wait for a clear rejection signal within the resistance zone before considering short positions. A stop-loss should be placed just above the recent high (105.861). The profit target for a short trade would be 105.000.
- Risk Management: Given the potential for whipsaw action around key levels, position sizing must be conservative. The risk on the trade (entry to stop-loss) should never exceed a small percentage of your total capital.
Conclusion
The CAD/JPY pair presents a classic technical setup, trading at a make-or-break resistance zone between 105.007 and 105.861. The market is offering a clear roadmap: a decisive breakout opens the path toward 106.3, while a rejection could see prices retreat back to 105.0. Traders should exercise patience, allowing the price to declare its intention at this critical juncture before committing capital. By adhering to the defined triggers and employing strict risk management, this setup offers a favorable opportunity to capitalize on the next significant move in this volatile cross.
How did this post make you feel?
Thanks for your reaction!


