Dow Jones at Major Resistance Analysis Points to Pullback
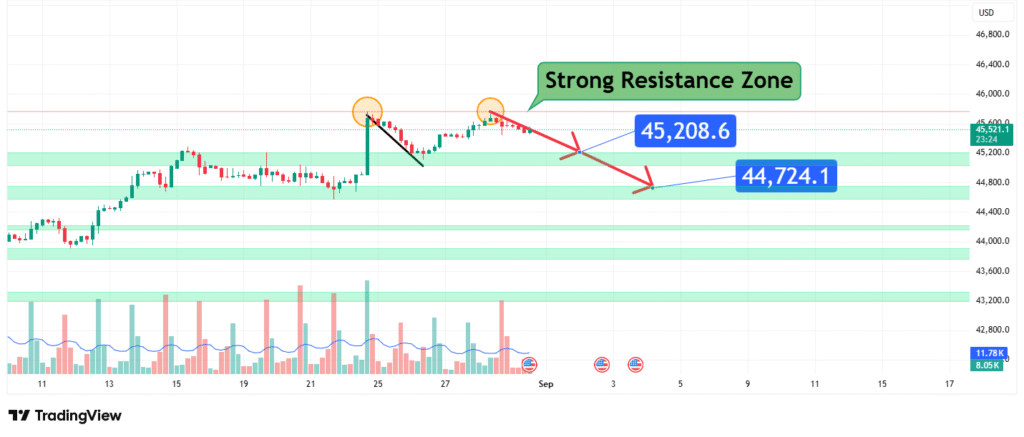
The Dow Jones Industrial Average (DJIA) is advancing into a technically significant and dense Strong Resistance Zone, bounded between approximately 44,724 and 45,209. This region represents a major obstacle that has historically triggered pullbacks. The current price action suggests the index is likely to experience a rejection from this zone, initiating a corrective phase toward lower support levels.
This analysis will deconstruct the anatomy of this critical resistance cluster, identify the key signals for a bearish reversal, and outline the projected downside targets should a sell-off commence.
Anatomy of a Strong Resistance Zone
A “Strong Resistance Zone” is not defined by a single price point but by a band where multiple technical factors converge, creating a high-probability area for selling pressure to emerge. The zone between 44,724 and 45,209 is potent due to the likely confluence of the following elements:
- Previous All-Time High (ATH) Resistance: The upper boundary of this zone, at 45,208.6, is almost certainly a historic or recent significant high. Price levels where previous rallies have peaked create immense psychological and technical resistance, as investors who bought at the top look to break even and early bulls take profits.
- Fibonacci Confluence: This zone likely aligns with a key Fibonacci extension or retracement level (e.g., the 127.2% or 161.8% extension of a prior move). These levels are heavily monitored by algorithmic and institutional traders, leading to a natural clustering of sell orders.
- Psychological Barrier: The 45,000 mark is a major psychological round number. The area just below it often acts as a profit-taking zone for long positions before the index attempts a decisive breakout into uncharted territory.
- Bearish Divergence Warning: Often, as price approaches such significant resistance, momentum oscillators like the Relative Strength Index (RSI) or the MACD begin to show bearish divergence (making lower highs while price makes a higher high). This is a classic warning sign that upward momentum is waning.
The synergy of these factors makes this zone a formidable “ceiling” that is unlikely to be broken on the first attempt without a significant fundamental catalyst.
The Bearish Scenario: Rejection and Retracement
The core thesis is that the price will react to this resistance cluster by reversing its upward momentum. For this scenario to be validated, traders should look for specific bearish reversal signals:
- Price Action Confirmation: The most direct evidence will be the formation of bearish reversal candlestick patterns at the resistance zone. A bearish engulfing pattern, a shooting star, or a series of indecisive doji candles would signal buyer exhaustion and seller aggression.
- Momentum Divergence: As mentioned, a bearish divergence on the RSI or MACD on the 4-hour or daily chart would powerfully reinforce the reversal thesis, indicating the rally is running on fumes.
- Break of Immediate Support: A decisive break below a nearby, short-term ascending trendline or the most recent swing low would confirm that selling pressure has overtaken buying interest and that the correction is officially underway.

Projected Downside Targets
A rejection from the 44,724 – 45,209 resistance zone offers a clear path for a retracement toward lower support. The following levels are identified as primary targets:
- Initial Target: $44,724
- This is the first and most immediate target, representing the lower boundary of the resistance zone itself. A pullback will often retest this level, which may then flip to act as initial, weak support. A break below it is highly probable.
- Primary Target: $45,208 (Invalidation Level)
- It is critical to note that $45,208 is not a downside target but rather the invalidation level for the entire bearish thesis. A sustained daily close, particularly on a weekly basis, above this entire resistance zone would signify a decisive breakout and a resumption of the bull trend. This would invalidate the outlook for an immediate correction and open the path for a continued grind higher.
*The provided data suggests a resistance zone and a pullback, but a clear secondary support target below $44,724 is not specified. A full analysis would require identifying the next major support level (e.g., a previous swing high or a key Fibonacci level around the 43,800 – 44,000 area) to project a deeper correction target.*
Trading Implications and Risk Management
This setup provides a strategic, defined-risk opportunity for traders.
- Bearish Entry: Traders may consider short positions or hedging strategies on clear rejection signals (e.g., a bearish pin bar or engulfing pattern) within the 44,724 – 45,209 resistance zone.
- Stop-Loss: A stop-loss is absolutely mandatory and must be placed above the highest point of the resistance zone, ideally above 45,250, to protect against a breakout scenario.
- Profit-Taking: Take-profit orders can be set near the $44,724 level for a partial exit, with the remainder of the position managed based on whether that support level holds or breaks.
Conclusion: A High-Probability Reversal Zone
The Dow Jones is trading into a technically saturated resistance zone where the probability of a bearish reversal is significantly elevated. Traders should be vigilant for signs of buyer exhaustion and seller dominance. A rejection from this zone projects a corrective move with an initial target back toward $44,724.
However, the market is dynamic. A powerful breakout above 45,209, fueled by strong volume and fundamental news, would completely negate this bearish perspective and signal renewed strength. Therefore, strict risk management, with a stop-loss above the resistance ceiling, is non-negotiable for any bearish positions initiated here.
Disclaimer: This article is for informational and educational purposes only and is based on technical analysis. It does not constitute financial advice or a recommendation to buy or sell any security. Trading indices involves a high level of risk and may not be suitable for all investors. The price predictions are the author’s personal perspective. Always conduct your own research and consider seeking advice from an independent financial advisor before making any trading decisions. Past performance is not indicative of future results.
How did this post make you feel?
Thanks for your reaction!


