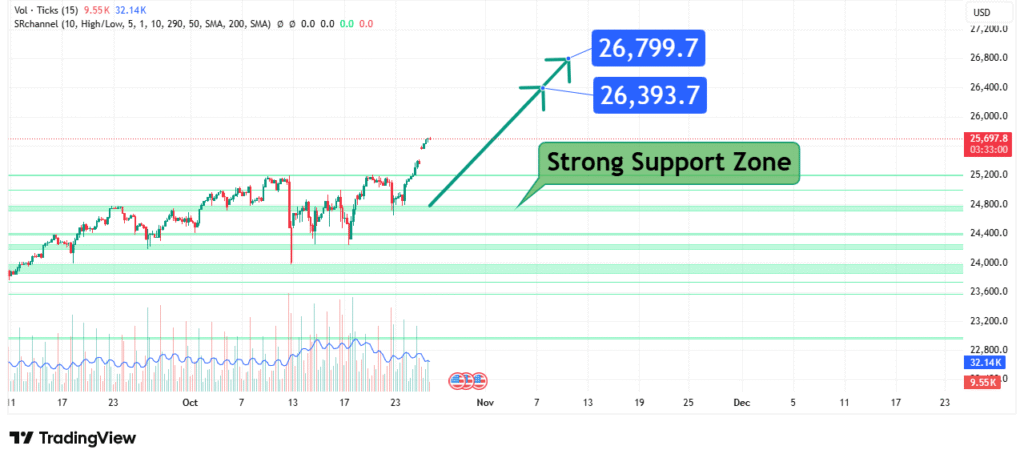
NASDAQ 100 (NDX) Price Analysis Bullish Reversal Targets 26,800
The NASDAQ 100’s price has staged a significant bullish reversal after a period of decline, finding a firm footing within a well-defined Strong Support Zone. This price action suggests that the recent sell-off has been exhausted and a new bullish wave is commencing. Our analysis projects a sustained upward move towards a primary target of 26,800, with an intermediate target at 26,400. This prediction is based on a confluence of technical factors, including the successful defense of a major support level and a clear shift in market structure.
Current Market Structure and Price Action
The market structure has transitioned from bearish to bullish. The index has formed a clear higher low at the support zone, breaking the sequence of lower lows. The price is now challenging a recent resistance level, and the momentum has clearly shifted in favor of the bulls. The strong bullish candles emerging from the support zone indicate significant buying pressure and a likely end to the corrective phase.
Identification of the Key Support Zone
The most critical technical element on the chart is the Strong Support Zone between approximately 25,600 and 25,800. The strength of this zone is derived from:
- Historical Significance: This level acted as a significant resistance ceiling in early November. Following a breakout, it has now retested this level as support—a classic bullish behavior confirming the level’s importance.
- Technical Confluence: The zone aligns with the 200-day Simple Moving Average (SMA), a primary benchmark used by institutions and traders to define the long-term trend. Holding this MA is a strongly bullish signal.
- Market Psychology: This area represents a value zone where long-term buyers and dip-buyers have aggressively stepped in, defending the long-term bullish trend and demonstrating strong conviction.
This powerful confluence of factors makes it a high-probability level for a sustained bullish reaction.
Technical Targets and Rationale
Our analysis identifies the following price targets:
Primary Target (PT1): 26,800
This level represents the recent swing high from early December. A break above the intermediate resistance at 26,400 would naturally target this previous peak, confirming the resumption of the broader uptrend.
Intermediate Target (PT2): 26,400
This is the immediate and more conservative target. It represents the first major resistance level and the mid-point of the recent trading range. A break above this level would serve as a strong confirmation of the bullish momentum.

Prediction: We forecast that the NASDAQ 100 will continue its ascent from the support zone, first challenging and breaking above the 26,400 level. Following a successful breach, the index is projected to advance towards our primary target at 26,800.
Risk Management Considerations
A professional strategy is defined by its risk management.
- Invalidation Level (Stop-Loss): The entire bullish thesis is invalidated if the price achieves a daily close below the strong support zone, specifically below 25,500. This level represents a clear break of the 200-day SMA and the newly formed higher low, signaling a failure of the bullish reversal pattern.
- Position Sizing: Any long positions taken (e.g., in CFDs, futures, or ETFs like QQQ) should be sized so that a loss triggered at the 25,500 invalidation level represents a small, pre-defined percentage of your total capital (e.g., 1-2%).
Fundamental Backdrop
The technical setup is supported by a shifting fundamental landscape:
- Factor 1: Dovish Federal Reserve Pivot: The market’s expectation that the Fed has finished its rate-hiking cycle and will pivot to cuts in 2024 is a powerful tailwind for growth-oriented technology stocks that dominate the NASDAQ 100.
- Factor 2: Resilient Corporate Earnings: Despite macroeconomic headwinds, earnings from major tech companies have largely remained resilient, supporting elevated valuations.
- Factor 3: Declining Bond Yields: Falling U.S. Treasury yields reduce the discount rate on future earnings, making tech stocks more attractive and easing financial conditions.
These factors contribute to the bullish sentiment surrounding the index, providing a fundamental rationale for the technical breakout.
Conclusion
The NASDAQ 100 is at a critical technical inflection point, having successfully defended a major support confluence. The weight of evidence from the bullish reversal, key technical levels, and supportive macro fundamentals suggests a high probability of an upward move, first to 26,400 and subsequently to 26,800. Traders should monitor for a sustained break above the immediate resistance and manage risk diligently by respecting the key invalidation level at 25,500.
Chart Source: TradingView
Disclaimer: This analysis is for informational and educational purposes only and does not constitute financial advice or a recommendation to buy or sell any security. All trading and investing involves significant risk, including the possible loss of your entire investment. Always conduct your own research (DYOR) and consider seeking advice from an independent financial professional before making any trading decisions.


