Accumulation The Ultimate Guide to the Smart Money Buying Phase
Accumulation is the foundational phase where smart money and informed investors gradually build their positions in an asset, often before a significant price rise. It represents a period of stealthy buying under the radar of the general public. Mastering the concept of accumulation is crucial for identifying major market turning points and aligning your strategy with powerful, long-term trends.
Summary Table
| Aspect | Detail |
|---|---|
| Definition | The process of acquiring a large position in a financial asset over a period of time, typically at lower prices and before a major bullish trend. |
| Also Known As | Smart Money Buying, Markup Phase (Wyckoff Theory), Buying the Dip |
| Main Used In | Technical Analysis, Stock Trading, Cryptocurrency, Portfolio Management |
| Key Takeaway | Identifying accumulation can signal a potential end to a downtrend and the beginning of a new uptrend, offering prime entry opportunities. |
| Formula | N/A (It is a phase identified through price action and volume analysis, not a calculation). |
| Related Concepts |
What is Accumulation
In finance, accumulation refers to the strategic and gradual purchasing of a substantial number of shares, contracts, or units of an asset. This activity is characterized by a series of smaller, strategic purchases rather than one massive trade that would immediately drive the value upward. Instead, it’s a sustained period of consistent buying interest, often occurring after a prolonged price decline when pessimism is high and the asset is considered undervalued.
Think of it like a savvy shopper waiting for a seasonal sale. They don’t buy all their winter clothes at full price in summer; they patiently wait for prices to drop and then gradually purchase what they need. In markets, large institutions act as these savvy shoppers, accumulating assets during the “sale” of a bear market.
Key Takeaways
The Core Concept Explained
The core of accumulation is the battle between informed buyers (“smart money”) and emotional sellers (“weak hands”). After a significant drop, the general public is often fearful and eager to sell. Large players with more capital and research step in to absorb this selling pressure.
This process creates specific technical signatures:
- Price Action: The asset stops making lower lows and begins to trade in a sideways range or channel. It finds a “floor” where buyers consistently emerge.
- Volume: This is the key tell. Periods of rising prices within the range will be accompanied by high volume, while price dips will see lower volume. This shows buying is aggressive and selling is lethargic.
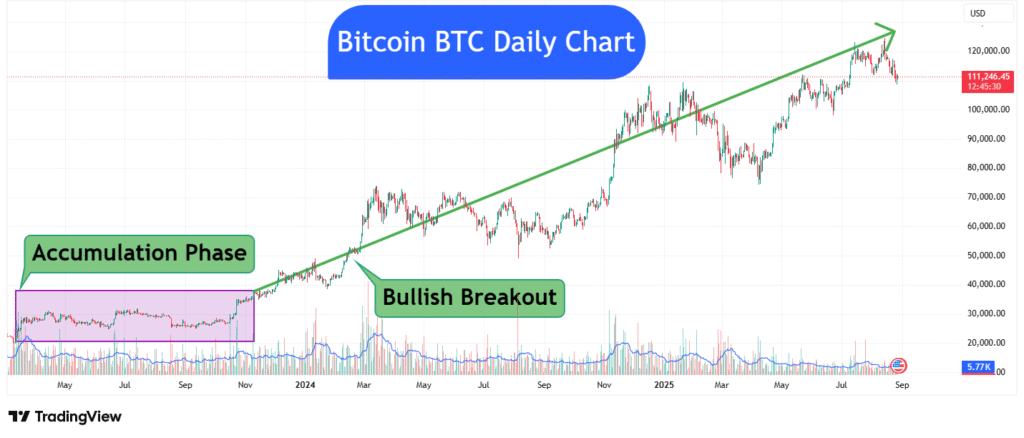
A well-executed accumulation period signals that available shares are being steadily purchased and taken off the market. Once the available supply is in strong hands, the path of least resistance is up, paving the way for a markup (bull) phase.
How is it Identified
Since accumulation is a phase and not a calculation, it is identified through technical analysis rather than a formula. Traders use a combination of tools to spot it.
Key Identification Criteria
- Price Consolidation: The asset must stop its downtrend and begin moving sideways, establishing clear support and resistance levels.
- Volume Analysis: This is the most critical factor. Look for:
- Up-volume Spike: Sharp price rises within the range on volume significantly higher than average.
- Down-volume Drip: Price declines within the range on volume that is below average.
- Indicator Confirmation: Tools like the Accumulation/Distribution Line (A/D Line) or On Balance Volume (OBV) can help. If these indicators are trending upward while the price is moving sideways, it signals that accumulation is likely occurring.
Why Accumulation Matters to Traders and Investors
- For Traders: Identifying accumulation provides a high-probability, low-risk entry point. Buying near the support level of an accumulation zone offers a clear stop-loss level (a break below support) and a profit target (the resistance level or a measured move based on the range’s height).
- For Investors: It helps distinguish between a temporary, undervalued opportunity and a “value trap”, a cheap asset that continues to get cheaper. Evidence of accumulation suggests that other major players also see value, validating the investment thesis.
- For Analysts: Understanding accumulation patterns allows analysts to gauge institutional sentiment and predict potential future demand for an asset.
How to Use Accumulation in Your Strategy
Use Case 1: The Range-Bound Breakout Trade
- Scenario: A stock has fallen 40% but has now been trading sideways for three months.
- Action: Draw support and resistance lines on the chart. Monitor the A/D Line or OBV. If they are rising, place a buy order just above the resistance level, anticipating a breakout. Your stop-loss goes just below the recent support.
- Screenshot: The annotated chart below shows a successful breakout from an accumulation zone, confirmed by strong volume.
Use Case 2: Accumulating Alongside “Smart Money”
- Scenario: An investor believes a blue-chip company is undervalued after a market panic.
- Action: Instead of investing a lump sum, they use a dollar-cost averaging (DCA) strategy, buying a fixed amount each week or month. This strategy emulates the accumulation process by acquiring assets at multiple price points throughout a range, thereby mitigating the risk associated with trying to pinpoint the absolute lowest price.
- Provides High-Conviction Setups: A well-identified accumulation zone offers a clear narrative of supply vs. demand.
- Defines Clear Risk: The support level provides a logical and well-defined point to exit the trade if the thesis is wrong.
- Aligns with Major Trends: It helps traders get in early on significant trends, often before they become headline news.
- Hindsight Bias: It’s often easier to label a period as “accumulation” after the price has already broken out.
- False Breakouts: The price may fake a breakout above resistance only to reverse back into the range, stopping out early buyers.
- Time-Consuming: Accumulation phases can last for weeks, months, or even years, requiring immense patience from traders.
Accumulation in the Real World: Bitcoin 2018 Crash
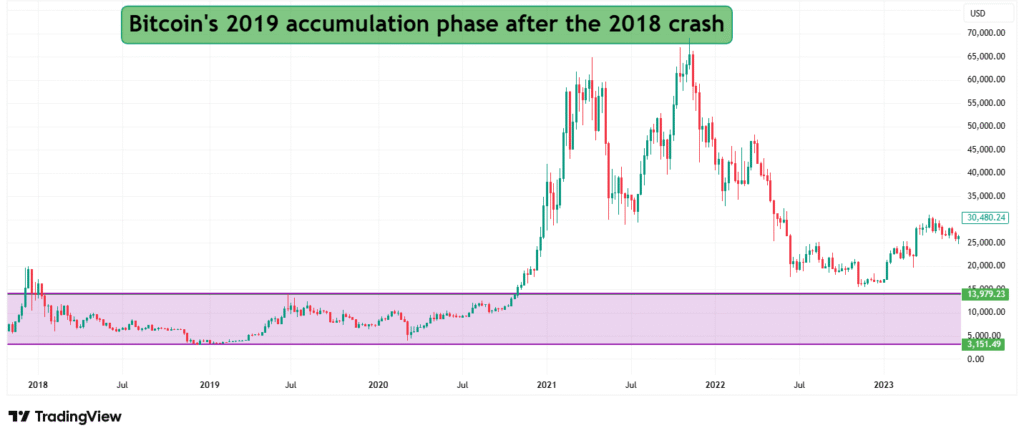
After its meteoric rise in 2017 to nearly $20,000, Bitcoin crashed throughout 2018, falling over 80% and bottoming around $3,200 by December 2018. The following year (2019) was a textbook accumulation phase.
- The Narrative: The public was convinced crypto was dead. Media sentiment was overwhelmingly negative.
- The Action: While retail investors were selling, institutional players and long-term believers were quietly accumulating. The price spent most of 2019 consolidating in a large range between ~$3,500 and ~$14,000, with volume patterns suggesting steady buying.
- The Result: This extended period of steady buying established a very solid base of support for the asset’s price. In late 2020, Bitcoin broke out of its accumulation range and began a historic markup phase, eventually reaching a new all-time high above $60,000 in 2021.

How Accumulation Relates to Other Concepts
The most common term confused with accumulation is Distribution. They are opposite phases in the market cycle.
| Feature | Accumulation | Distribution |
|---|---|---|
| Phase | Occurs after a downtrend, before an uptrend. | Occurs after an uptrend, before a downtrend. |
| Smart Money Action | Buying from the public. | Selling to the public. |
| Volume Signature | High volume on up moves, low volume on down moves. | High volume on down moves, low volume on up moves. |
| Market Sentiment | Pessimistic, fearful. | Euphoric, greedy. |
Related Terms
- Volume Analysis: The primary tool used to confirm accumulation.
- Wyckoff Method: A foundational theory of technical analysis that places the accumulation phase at the heart of its market cycle model.
- Support and Resistance: Key levels that define the boundaries of an accumulation zone.
- Dollar-Cost Averaging (DCA): An investment strategy that mimics the accumulation process.
Frequently Asked Questions
Recommended Resources
- Investopedia: Accumulation/Distribution Indicator (A/D) – A definitive guide on the key indicator
- StockCharts.com: Wyckoff Method – A detailed overview of the theory that defines accumulation
- SEC.gov: Investor Bulletin – Dollar-Cost Averaging – An authoritative take on the accumulation strategy
How did this post make you feel?
Thanks for your reaction!
