ChainLink Price Prediction Rising Wedge Points to Drop to $17
A concerning technical pattern is materializing on the Chainlink (LINK) chart, signaling a potential end to its recent consolidation phase and pointing toward a significant bearish move. The formation of a Rising Wedge pattern, a classic bearish reversal structure, suggests that despite making higher highs and higher lows, the upward momentum is weakening, and a breakdown is increasingly probable.
This analysis will deconstruct the pattern, identify key levels, and outline the projected price targets should the anticipated breakdown occur.
Identifying the Rising Wedge Pattern
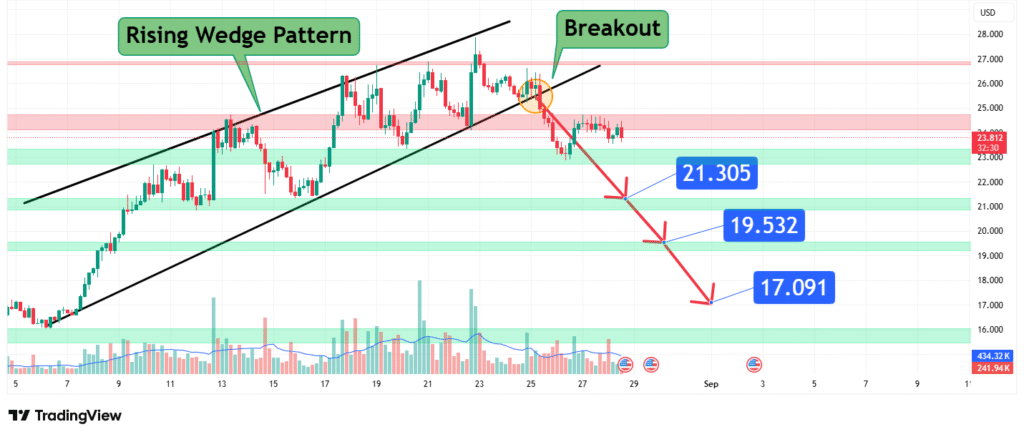
A Rising Wedge is characterized by two converging, upward-sloping trendlines that contract price action into a narrowing range. While the price creates a series of higher highs and higher lows, the slope of the wedge is noticeably steeper than the prior uptrend, indicating that each successive push upward is losing conviction.
- Upper Trendline (Resistance): Connects the swing highs of the recent price action. Each test of this line has been met with increasing selling pressure.
- Lower Trendline (Support): Connects the swing lows. While this line has provided dynamic support, the weakening momentum is evident in the convergence with the upper line.
The critical feature of this pattern is its tendency to resolve downwards. The constant contraction of price volatility within the wedge typically culminates in a breakout in the direction of the underlying trend’s exhaustion, in this case, to the downside.
The Impending Breakdown: Key Levels to Watch
The entire thesis of a bearish move hinges on a decisive break below the wedge’s lower support trendline. For the signal to be considered valid, this breakdown should be accompanied by a noticeable increase in trading volume, confirming participant conviction in the move.
- Breakout Confirmation Level: A daily close (preferably on a 4-hour or daily chart) below the lower trendline, currently sitting near the $21.30 mark, would serve as the initial confirmation of the pattern’s activation. This level is no longer a support but becomes a new resistance.
- Volume Confirmation: Ideally, the breakdown candle will show volume significantly higher than the recent average, indicating strong selling pressure rather than a mere false breakout.
Projected Price Targets Following a Breakdown
The measured move target for a Rising Wedge is derived from the maximum height of the pattern’s widest point, projected downward from the point of breakdown.
Based on the provided analysis and this technical methodology, the following price targets are projected:
- Initial Target: $19.53
- This is the first significant support level and the initial profit target for the move. A breach below the $21.30 support would likely see a swift move down to test this zone, where some buyers may initially step in.
- Primary Target: $17.09
- This represents the full measured move target of the wedge pattern and is the primary objective for this bearish setup. A break below the $19.53 level would open the path for LINK to target this region, which often acts as a strong psychological and technical support area.
These targets provide a clear roadmap for the potential decline, offering strategic points for risk management.
Trading Implications and Risk Management
For traders, this setup presents a clear opportunity with defined parameters.
- Bearish Entry: A short position can be considered on a confirmed break and retest of the $21.30 support-turned-resistance level.
- Stop-Loss: A prudent stop-loss should be placed just above the most recent swing high within the wedge or above the upper trendline. This invalidates the breakdown thesis if price reclaims the pattern.
- Profit-Taking: Positions can be scaled out at the $19.53 and $17.09 targets to manage risk and lock in profits.
Conclusion: A Cautionary Signal for LINK Bulls
The developing Rising Wedge on the Chainlink chart is a potent bearish reversal pattern that cannot be ignored. It suggests that the buying pressure responsible for the higher highs is faltering. A confirmed breakdown below the $21.30 support level would validate this outlook and trigger a sell-off with projected targets first at $19.53 and ultimately at $17.09.
As with all technical analysis, this is a probabilistic scenario, not a guarantee. Traders should wait for confirmation before acting and always employ strict risk management protocols to protect their capital against unexpected market moves.
Chart Source: TradingView
Disclaimer: This analysis is based on technical patterns and is for informational purposes only. It does not constitute financial advice. Trading commodities involves significant risk, and you should conduct your own research before making any investment decisions.
How did this post make you feel?
Thanks for your reaction!
