Crude Oil Technical Analysis Targeting a Breakdown to $67.46 and $66.73
Crude Oil (WTI) is exhibiting clear bearish characteristics, characterized by a series of lower highs and a break below previous consolidation levels. The price is currently challenging a defined but technically “Weak Support Zone” around the $67.00 – $67.50 area. Given the lack of strong historical buying interest in this zone and the prevailing downward momentum, a breakdown appears probable. Our analysis projects a continuation of the sell-off towards two primary downside targets: first at $67.46 and subsequently at $66.73.
Current Market Structure and Price Action
The chart structure is decisively bearish. Price has rolled over from a recent high near $68.50 and has broken below the $68.00 handle with conviction. The formation of lower highs indicates that sellers are consistently overwhelming buyers at progressively lower price levels. The current price is hovering just above the $67.00 level, within the weak support zone, showing signs of hesitation but lacking bullish reversal signals.
Identification of the “Weak Support Zone”
The chart is explicitly annotated with a “Weak Support Zone.” This is a critical technical observation. Unlike a “Strong Support” area with multiple historical touchpoints, a weak zone suggests:
- Limited Historical Significance: The price level may have been tested only once or twice before, indicating a lack of proven buyer commitment.
- Psychological, Not Technical: The zone may align with a round number ($67.00) but lacks a confluence of other technical factors (e.g., Fibonacci retracement, moving average, previous swing low).
This inherent weakness makes it a high-probability candidate for a breakdown amidst sustained selling pressure.
Technical Targets and Rationale
Our bearish forecast identifies two precise targets below the current support:
- Primary Target (PT1): $67.46
This level likely represents a recent minor swing low or a measured move target. A break below the weak support zone often sees price accelerate down to the next visible level of historical price action, which in this case is $67.46. - Secondary Target (PT2): $66.73
This is the more significant target and represents a major previous low. A breach of PT1 ($67.46) would confirm renewed selling momentum and likely propel the price down to test this more substantial level at $66.73. This level would be expected to provide a much stronger reaction, potentially leading to a consolidation or a larger bounce.
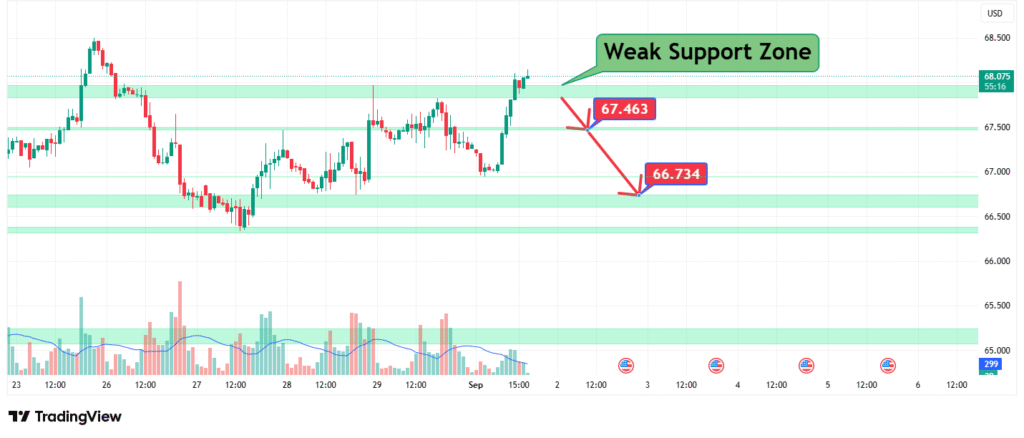
Prediction: We forecast that the weak support zone around $67.00 will fail to hold. The ensuing breakdown should target an initial decline to $67.46, followed by a stronger push towards the $66.73 level.
Risk Management Considerations
A professional approach mandates defining the point at which the bearish thesis is incorrect.
- Invalidation Level (Stop-Loss): The bearish outlook is invalidated by a price recovery above the recent structure, specifically a break and daily close above the $68.50 level. Such a move would negate the lower high formation and suggest a potential false breakdown, opening the door for a move higher towards $69.00 or beyond.
- Position Sizing: Any short positions or bearish strategies should be implemented with a stop-loss order placed above $68.50, ensuring risk is precisely quantified and managed.
Fundamental Backdrop
The technical bearish setup is contextualized by fundamental headwinds:
- Demand Concerns: Fears of an economic slowdown or recession in major economies continue to weigh on the outlook for oil demand.
- USD Strength: Oil is priced in U.S. dollars. A strengthening dollar makes oil more expensive for holders of other currencies, potentially dampening demand.
- Alternative Sources: The market may be adequately supplied, reducing the geopolitical risk premium that often buoys prices.
These factors contribute to the negative sentiment reflected in the price chart.
Conclusion
The technical picture for Crude Oil points to further downside. The price is testing a fragile support level that shows few signs of strong buyer defense. We anticipate a breakdown that will initially target $67.46, with a follow-through move to $66.73 highly probable. Traders should monitor for bearish confirmation signals (e.g., a strong bearish candle closing below $67.00) and always manage risk by defining the invalidation point at $68.50.
Chart Source: TradingView
Disclaimer: This analysis is for informational purposes only and does not constitute a recommendation to buy or sell any security. All trading involves significant risk.
How did this post make you feel?
Thanks for your reaction!
