GBPJPY Faces Key Resistance Forecast for a Pullback to 195.00
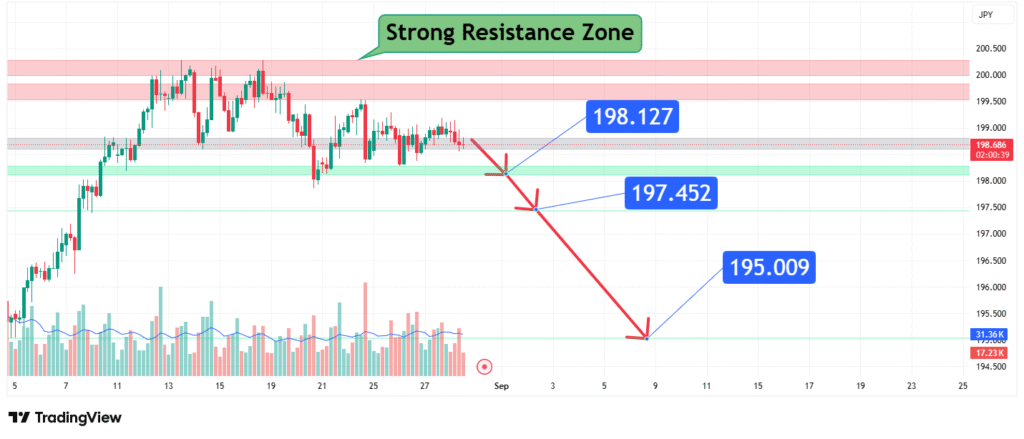
The GBP/JPY pair is approaching a critical juncture on the charts as it tests a well-defined and historically significant resistance cluster. This convergence of multiple technical barriers, located between 197.452 and 195.009, presents a formidable obstacle for bulls. The current price action suggests that a rejection from this zone is the highest probability outcome, potentially triggering a corrective move toward lower support levels.
This analysis will deconstruct the composition of this resistance zone, outline the conditions for a bearish reversal, and project the key downside targets should a pullback commence.
Deconstructing the Strong Resistance Zone
The term “Strong Resistance Zone” indicates that it is not a single, solitary price level, but rather a band where several technical factors align to create a high-concentration area of selling pressure. This specific zone, between approximately 195.009 and 197.452, is likely composed of the following elements:
- Multi-Swing High Resistance: The upper boundary of the zone (near 197.452) likely represents a recent significant swing high. Price has previously reacted to this level by moving lower, establishing it as a clear technical ceiling.
- Fibonacci Retracement Level: The zone likely encapsulates a key Fibonacci retracement level (e.g., the 61.8% or 78.6% retracement from a prior major move). These levels are self-fulfilling prophecies where traders anticipate reversals and place their orders.
- Psychological Resistance: The round number of 197.000 and the proximity to the major 198.000 level act as psychological barriers, often triggering profit-taking on long positions.
- Trend Line Resistance: A medium or long-term bearish trend line may also be converging with this horizontal zone, adding another layer of technical significance.
The confluence of these factors makes this area a “ceiling” that will be exceptionally difficult for buyers to break through on the first attempt.
The Bearish Scenario: Rejection and Retracement
The core thesis is that the price will react to this resistance cluster by reversing its upward momentum. For this scenario to be validated, traders should look for specific bearish reversal signals:
- Price Action Confirmation: The most direct signal would be the formation of bearish candlestick patterns at the resistance zone. A bearish engulfing pattern, a shooting star, or a series of small-bodied candles (indecision) after a strong run-up would all be early warning signs.
- Momentum Divergence: Observing oscillators like the Relative Strength Index (RSI) or the MACD on the 4-hour or daily chart is crucial. If the price makes a new high within the resistance zone but these indicators print a lower high (bearish divergence), it signals underlying weakening momentum and strongly supports the reversal thesis.
- Break of Local Support: A decisive break below a nearby, short-term ascending trendline or a minor support level (e.g., 196.000) would confirm that the selling pressure has overwhelmed the buyers and that the correction is underway.

Projected Downside Targets
A rejection from the resistance zone offers a clear path for a retracement toward lower support. The following levels are identified as primary targets:
- Initial Target: $197.40 (Re-test of Zone Low)
- The first logical target is a fall back to the lower boundary of the resistance zone itself, around 197.40. This level, which was previously resistance, may now act as initial minor support. However, a break below it is highly likely.
- Primary Target: $195.00 (Key Support)
- This is the primary and most significant target. It represents a major previous resistance level that has now turned into support (a classic “role reversal”) and is a strong technical magnet for price during a pullback. This is where one would expect the bulk of the corrective move to terminate and for buyers to re-emerge with conviction.
- Extension Target: $198.10 (Invalidation Level)
- It is critical to note that $198.10 is not a downside target but rather the invalidation level for this entire bearish thesis. A sustained daily close above the entire resistance zone, particularly above 198.10, would signify a decisive breakout. This would invalidate the bearish outlook and open the path for a continuation of the rally toward new highs.
Trading Implications and Risk Management
This setup provides a high-probability, defined-risk trading opportunity.
- Bearish Entry: Traders may consider short positions on clear rejection signals (e.g., a bearish pin bar or engulfing pattern) within the 197.452 – 195.009 resistance zone.
- Stop-Loss: A stop-loss must be placed above the highest point of the resistance zone, ideally above 198.10, to protect against a breakout scenario.
- Profit-Taking: Take-profit orders can be set in two stages: the first near 197.40 and the primary target at 195.00.
Conclusion: A High-Probability Retracement Setup
GBP/JPY is trading into a technically saturated resistance zone where the probability of a bearish reversal is significantly elevated. Traders should be on high alert for signs of seller dominance and momentum exhaustion. A rejection from this zone projects a corrective move toward the 195.00 support level.
However, the market is dynamic, and a powerful breakout above 198.10 would completely negate this bearish perspective. Therefore, strict risk management, with a stop-loss above the resistance ceiling, is paramount for any bearish positions initiated here.
Chart Source: TradingView
Disclaimer: This analysis is based on technical patterns and is for informational purposes only. It does not constitute financial advice. Trading commodities involves significant risk, and you should conduct your own research before making any investment decisions.
How did this post make you feel?
Thanks for your reaction!


