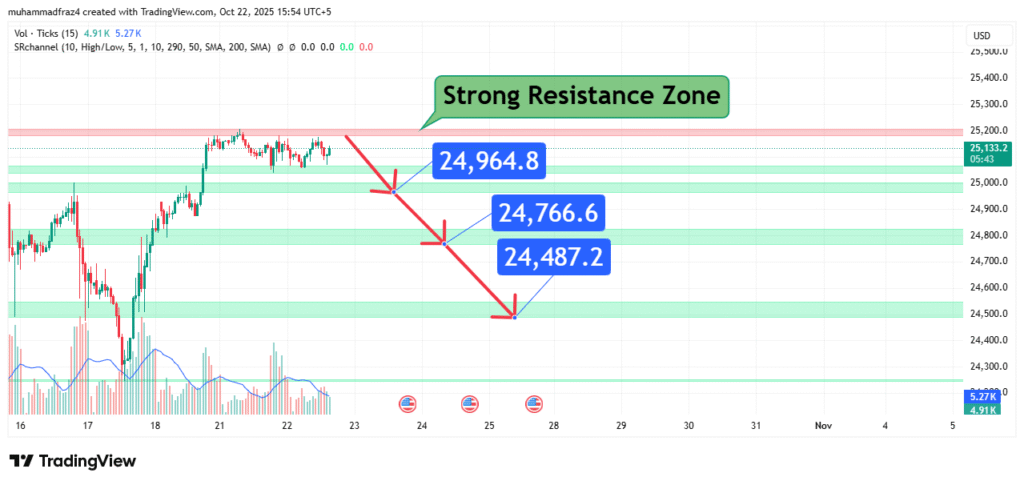
NASDAQ 100 (NDX) Price Analysis Bearish Pullback to 24,500 Zone Imminent
The NASDAQ 100’s price has been rallying strongly but is now facing a significant and well-defined Strong Resistance Zone between $24,487 and $24,965. This price action suggests a bearish bias is forming for a short-term pullback. Our analysis projects a move downwards towards a primary target of $24,487, with intermediate targets at $24,964 and $24,766. This prediction is based on a confluence of technical factors, including a key resistance zone, potential for bearish rejection, and the principle of mean reversion after a strong upward move.
Current Market Structure and Price Action
The broader market structure for the NASDAQ 100 remains bullish, characterized by a series of higher highs and higher lows. However, on a shorter-term basis, the price is currently interacting with a strong resistance zone. Recent price action shows the index struggling to break decisively above the $25,200 level, indicating that buyer momentum may be exhausting. The formation of this resistance zone, as highlighted in the provided chart, suggests that a bearish reversal or a significant pullback may be imminent as profit-taking kicks in.
Identification of the Key Resistance Zone
The most critical technical element is the Strong Resistance Zone between approximately $24,487 and $24,965. The strength of this zone is derived from:
- Historical Significance: The upper boundary of this zone, around $24,965, likely represents a recent or all-time high, a level that has previously acted as a major swing high.
- Technical Confluence: The zone is not a single line but a band, incorporating the levels of $24,487, $24,766, and $24,965. This multi-layered resistance creates a formidable barrier for buyers.
- Market Psychology: This area represents a point where sellers (profit-takers) are likely to become more aggressive, and new buyers may be hesitant to enter, fearing a top.
This confluence makes it a high-probability level for a bearish reaction.
Technical Target(s) and Rationale
Our analysis identifies the following price targets for the anticipated pullback:
Initial Target (T1): $24,964
This is the first line of defense within the resistance zone. A break below the current price would likely see an initial test of this level, which may now act as minor support.
Secondary Target (T2): $24,766
This level represents a stronger support within the broader resistance-turned-support zone. A break below T1 would likely see the price descend to test this more significant level.
Primary Target (PT): $24,487
This is the lower boundary of the identified zone and represents the most substantial support level. A move to this level would constitute a full retest of the breakout area, offering a high-probability bounce-or-break scenario.

Prediction: We forecast that the price will face rejection from the current resistance and move down towards T1 at $24,964. A sustained bearish momentum would then drive the price further down to T2 at $24,766, and ultimately towards our primary target (PT) at $24,487.
Risk Management Considerations
A professional strategy is defined by its risk management.
- Invalidation Level (Stop-Loss): The entire bearish thesis is invalidated if the price achieves a decisive daily close above the resistance zone, specifically above $25,050. This level represents a clear break of the market structure that justifies our prediction, indicating that bullish momentum has overcome the selling pressure.
- Position Sizing: Any short positions taken should be sized so that a loss triggered at the invalidation level represents a small, pre-defined percentage of your total capital (e.g., 1-2%).
Fundamental Backdrop
The technical setup is framed by the current fundamental landscape:
- Interest Rate Sensitivity: The NASDAQ 100, heavily weighted towards tech and growth stocks, remains highly sensitive to Federal Reserve interest rate expectations. Hawkish commentary could fuel the predicted sell-off.
- Q3 Earnings Season: We are in the thick of the Q3 earnings season. Disappointing results from key index components could be the catalyst that triggers the pullback from resistance.
- Geopolitical Tensions: Ongoing global uncertainties contribute to market volatility and risk-off sentiment, which often negatively impacts growth-oriented indices like the NASDAQ 100.
These factors contribute to the cautious and potentially bearish sentiment surrounding the asset in the near term.
Conclusion
The NASDAQ 100 is at a technical inflection point, testing a robust resistance zone. The weight of evidence suggests a bearish resolution in the short term, targeting a pullback to $24,964, $24,766, and ultimately $24,487. Traders should monitor for a confirmed bearish reversal pattern (e.g., a bearish engulfing candle) at this resistance and manage risk diligently by respecting the key invalidation level above $25,050. The reaction at the primary target zone of $24,487 will be crucial for determining whether this is a healthy pullback within a bull market or the start of a deeper correction.
Chart Source: TradingView
Disclaimer: This analysis is for informational and educational purposes only and does not constitute financial advice or a recommendation to buy or sell any security. All trading and investing involves significant risk, including the possible loss of your entire investment. Always conduct your own research (DYOR) and consider seeking advice from an independent financial professional before making any trading decisions.


