
NASDAQ-100 Tests Critical Support A Bounce Toward 24,510 Imminent
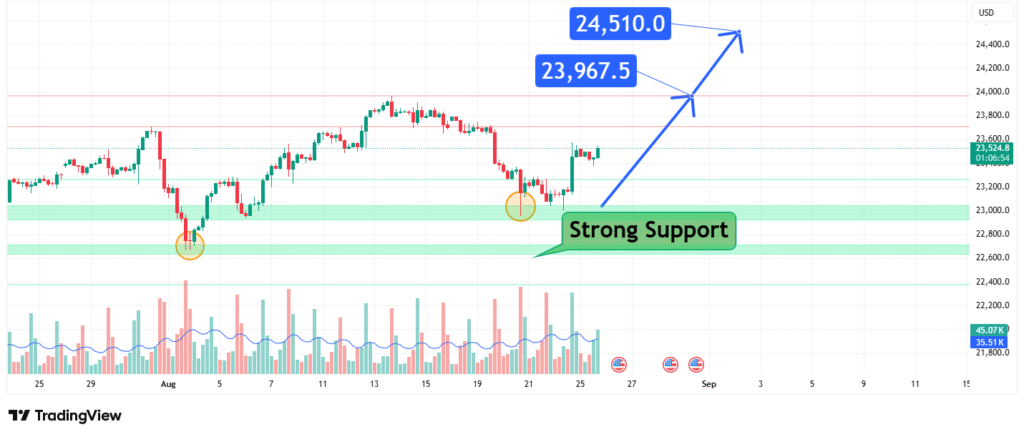
The NASDAQ-100 index (NDX), a key barometer for technology and growth stocks, is currently engaged in a critical technical battle. After a period of decline or consolidation, the price has reached a significant area annotated on the chart as “Strong Support.” This zone represents a historical level where buying interest has historically overwhelmed selling pressure, providing a springboard for previous rallies. The price action shows the index testing this foundational level, a move that will determine the next major directional leg. Holding this support is paramount for the bullish case, as a failure here could open the door to a much deeper correction. This analysis argues that this support will hold and catalyze a substantial bullish reversal.
The Anatomy of the Strong Support Zone
In technical analysis, a “Strong Support” zone is not a single line but a price band where multiple factors converge to create a robust floor for the market. This zone, located between approximately 23,967.5 and 24,510.0, likely represents a confluence of several key technical elements:
- Previous Resistance Turned Support: A prior significant resistance level that, once broken, often flips to become support.
- Major Fibonacci Retracement Level: A key retracement level (e.g., the 61.8% or 50% Fib) of a prior major upward move.
- Psychological Price Level: A large, round number that attracts institutional buying interest.
The repeated tests of this area, as shown by the cluster of price action around it, further solidify its importance. Each successful hold reinforces the zone’s strength and increases the probability of a powerful bullish reaction.
Bullish Price Projection and Upside Targets
The successful defense of a strong support zone typically leads to a corrective rally toward the most recent significant resistance level. The initial upside target from the current support base is the upper boundary of this zone at 24,510.0. A decisive break above this level would confirm that the bounce has momentum and is likely to extend further. The next logical target beyond that would be the next major resistance level, which often coincides with a recent swing high or a key psychological barrier. The structure suggests that a rally initiating from this support zone has a clear path to begin a move toward these higher levels, with 24,510 acting as the first key benchmark for bullish momentum.
Risk Management: The Line in the Sand
While the bullish bounce scenario is compelling, it is entirely contingent on the support zone holding firm. Therefore, defining the invalidation point is crucial. The bearish scenario would be confirmed if the price were to sustain a decisive break below the strong support zone, particularly a daily close significantly below 23,967.5. Such a break would indicate a failure of buyers to defend the level, potentially triggering a new wave of selling that could target much lower support areas, perhaps in the 23,200 – 23,400 range. Traders must respect this line in the sand; the bullish thesis is only valid while the price remains above this critical floor.
Conclusion: Positioning for a Probable Bounce
In conclusion, the NASDAQ-100 is perched at a make-or-break technical level. The evidence provided by the chart suggests the “Strong Support” zone between 23,967.5 and 24,510.0 is likely to hold. This presents a high-probability setup for a tradable bounce, with an initial target at the top of the support range (24,510). Traders might consider this a potential area to initiate long positions or cover short positions, with a tight stop-loss placed below the key support level. Investors could view any dip into this zone as a strategic accumulation opportunity within the longer-term trend. The market is at an inflection point, and the weight of technical evidence favors the bulls for a meaningful counter-trend move.
How did this post make you feel?
Thanks for your reaction!
