USOIL Price Analysis Rejection at Resistance Eyes $61.80 Target
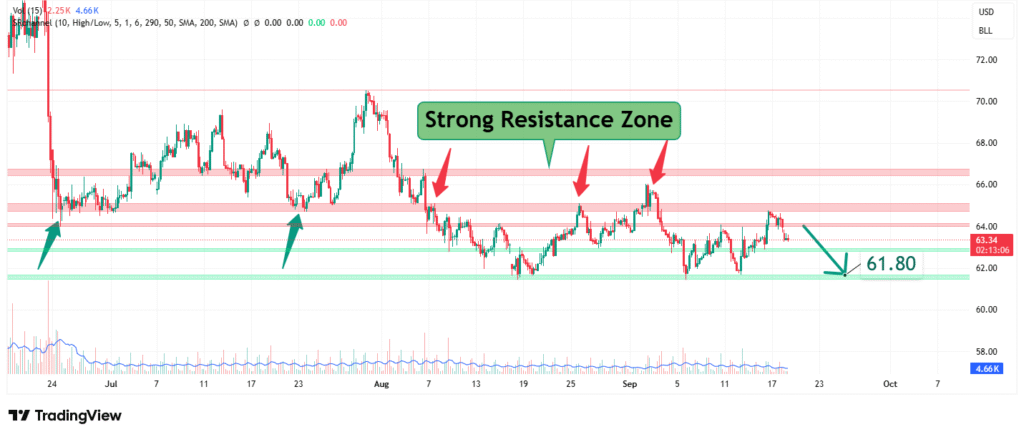
USOIL’s price has rallied into a formidable and well-established resistance zone converging around the $64.00 level. This price action, after a significant upward move, suggests a potential reversal point is being reached. Our analysis projects a bearish rejection from this zone, with a primary target set at $61.80. This prediction is based on a confluence of technical factors, primarily the strength of the resistance area and the potential for a classic rejection pattern.
Current Market Structure and Price Action
The broader market structure for USOIL has been bullish throughout September, characterized by a steady climb from the lows near $72. However, the price is now interacting with a ceiling that has capped rallies on multiple occasions since July. The current approach to this zone has not yet shown a decisive breakout, indicating buyer exhaustion and potential seller aggression. This suggests the market structure may be transitioning from bullish to ranging or bearish, contingent on a rejection from this key level.
Identification of the Key Resistance Zone
The most critical technical element on the chart is the “Strong Resistance Zone” clearly marked just below the $64.00 level. The strength of this zone is derived from:
- Historical Significance: This level has acted as a major swing high and resistance point on at least three significant occasions in late July, mid-August, and now. Each touch has resulted in a notable price rejection, cementing its importance.
- Technical Confluence: The zone aligns with a key psychological round number ($64.00), which often acts as a magnet for price action and a barrier for trends.
- Market Psychology: This area represents a point where previous sellers who missed the initial decline are likely to re-enter short positions, and buyers who bought lower may look to take profits. This creates a natural supply overload.
This multi-touch confluence makes it a high-probability level for a bearish reaction.
Technical Target(s) and Rationale
Our analysis identifies the following price target:
- Primary Target (PT1): $61.80
Rationale: The $61.80 level represents the most recent and significant swing low from early October. A rejection from the $64 resistance would inherently target this previous level of support. A break below $61.80 would open the path towards lower targets, potentially in the $60.50-$60.00 region.

Prediction: We forecast that USOIL will fail to break meaningfully above the $64.00 resistance zone and will instead turn lower, initiating a decline towards our primary target of $61.80 in the upcoming days.
Risk Management Considerations
A professional strategy is defined by its risk management.
- Invalidation Level (Stop-Loss): The entire bearish thesis is invalidated if the price achieves a daily close above the strong resistance zone, specifically above $64.50. This level is chosen because it represents a clear break of the established multi-month resistance structure, signaling that buyers have overcome all supply and that the uptrend is likely resuming.
- Position Sizing: Any short positions taken should be sized so that a loss triggered at the $64.50 invalidation level represents a small, pre-defined percentage of your total capital (e.g., 1-2%).
Fundamental Backdrop
The technical setup is framed by the current fundamental landscape:
- Geopolitical Tensions: Any escalation in conflict in oil-producing regions (e.g., Middle East) could spark a supply fear-driven breakout higher, invalidating the technical setup.
- OPEC+ Policy: The group’s production decisions remain a primary driver of oil prices. Dovish rhetoric or hints at increasing supply could fuel the bearish move, while hints at cuts would support prices.
- Global Demand Outlook: Concerns about a global economic slowdown, particularly in China, continue to create a bearish undercurrent for oil demand forecasts.
- USD Strength: A strengthening US Dollar can exert downward pressure on dollar-denominated commodities like oil.
These factors currently contribute to a neutral-to-bearish sentiment surrounding the asset, supporting the technical outlook.
Conclusion
USOIL is at a critical technical juncture, testing a ceiling that has proven formidable for months. The weight of evidence suggests a bearish rejection from this zone, targeting a decline to $61.80. Traders should monitor for signs of rejection (e.g., bearish engulfing candles, pin bars) at this resistance and manage risk diligently by respecting the key invalidation level at $64.50. A break below $61.80 will be crucial for confirming a deeper corrective move.
Chart Source: TradingView
Disclaimer: This analysis is for informational and educational purposes only and does not constitute financial advice or a recommendation to buy or sell any security. All trading and investing involves significant risk, including the possible loss of your entire investment. Always conduct your own research (DYOR) and consider seeking advice from an independent financial professional before making any trading decisions.


