How to Use the ADX Indicator for Better Trading Entries and Exits
The Average Directional Index (ADX) is a powerful technical analysis indicator used solely to measure the strength of a trend. It doesn’t tell you the direction, but how powerful the current move is, helping traders in volatile markets like forex and stocks avoid false signals and capitalize on strong trends.
For active traders in the US, UK, Canada, and Australia analyzing markets like the NYSE, NASDAQ, or Forex pairs, the ADX is an indispensable tool for filtering out market noise and identifying high-probability, high-momentum trades.
Summary Table
| Aspect | Detail |
|---|---|
| Definition | A technical indicator that quantifies the strength of a price trend. |
| Also Known As | ADX |
| Main Used In | Trend-following strategies in Stock, Forex, Commodity, and Crypto trading. |
| Key Takeaway | The ADX measures trend strength, not direction. A high ADX signals a strong trend, while a low ADX indicates a weak or ranging market. |
| Formula | Complex, based on a smoothed average of the Directional Movement (DX), which itself is derived from the +DI and -DI lines. |
| Related Concepts |
What is the Average Directional Index (ADX)
Developed by J. Welles Wilder Jr., the Average Directional Index (ADX) is a core component of the Directional Movement System. In simple terms, think of it as a trend strength meter. Imagine you’re driving: the +DI and -DI (components of the ADX system) tell you if you’re going North or South, but the ADX tells you how fast you’re going. A high speed (high ADX) means you’re in a strong trend, while being stuck in traffic (low ADX) means the market is choppy and directionless.
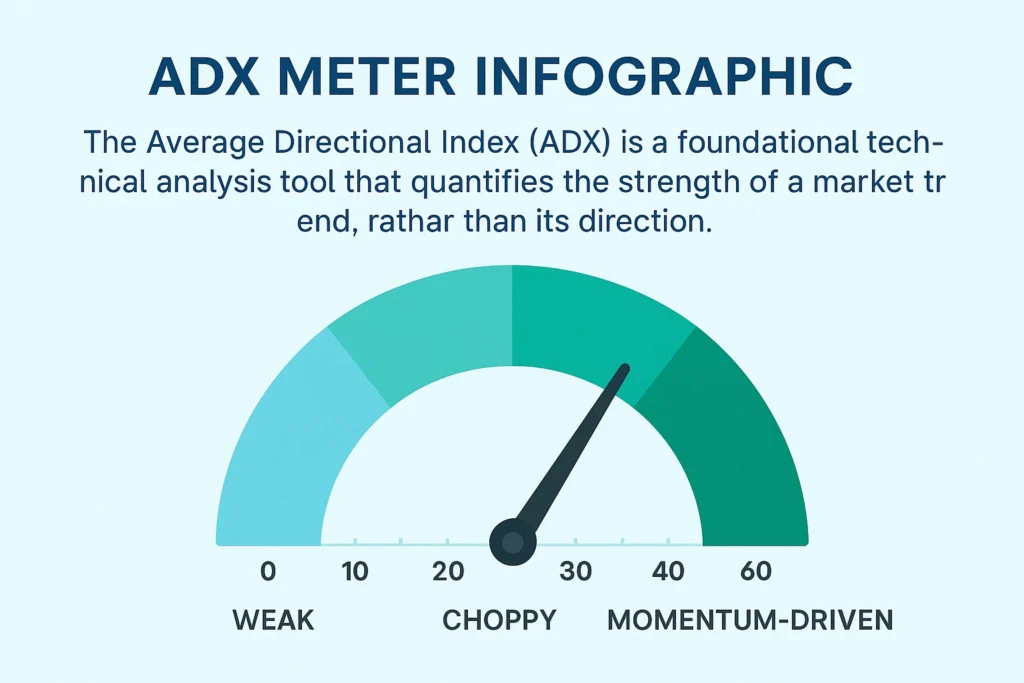
Key Takeaways
The Core Concept Explained
The ADX doesn’t care if the market is going up or down. It only cares about the intensity of the move. This is incredibly valuable because trading with the trend is a foundational principle, and the ADX helps you identify when a true trend is in play versus when the market is just wandering. It smooths out price data to filter out minor retracements and noise, giving you a clearer picture of the underlying momentum.
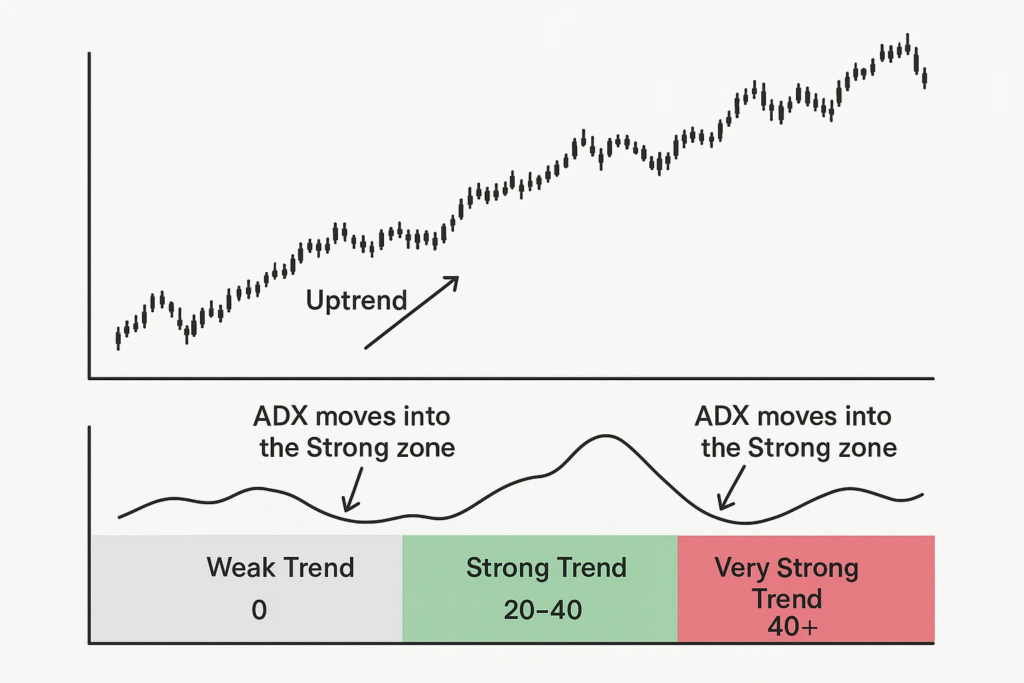
How to Calculate the Average Directional Index
The ADX calculation is complex and is best handled by modern charting software. However, understanding the components is crucial. The formula is derived from the Directional Movement Index (DMI).
ADX = Smoothed average of the Directional Movement (DX)
Step-by-Step Calculation Guide
The process involves multiple steps over a default 14-period setting:
- Calculate +DM and -DM: +DM (Positive Directional Movement) is the current high minus the previous high. -DM (Negative Directional Movement) is the earlier low subtracted with the recent low. These values are filtered to only include the larger of the two if they are positive.
- Calculate the True Range (TR): TR is the greatest of: (Current High – Current Low), |Current High – Previous Close|, or |Current Low – Previous Close|.
- Smooth the +/-DM and TR: Smooth these 14-period values using Wilder’s smoothing method (which is similar to an exponential moving average).
- Calculate the Directional Indicators (+DI and -DI):
- +DI = (Smoothed +DM / ATR) * 100
- -DI = (Smoothed -DM / ATR) * 100
- Calculate the Directional Movement Index (DX):
- DX = ( | +DI – -DI | / ( +DI + -DI ) ) * 100
- Calculate the ADX: Finally, the ADX is the smoothed average of the DX.
Example Calculation: Let’s look at a stock like Tesla (TSLA) listed on the NASDAQ. After performing the above steps over 14 days, you find the smoothed +DI14 is 35 and the smoothed -DI14 is 18.
- DX = ( |35 – 18| / (35 + 18) ) * 100 = (17 / 53) * 100 ≈ 32.08
- The ADX would then be a 14-period smoothed average of this and previous DX values. An ADX reading of 32, for a US-listed stock like Tesla, clearly signals a strong trending condition.
Why the Average Directional Index (ADX) Matters to Traders and Investors
- For Traders: The ADX is a filter for your strategy. It helps answer the critical question: Is this market even tradable for my trend-following system? By avoiding low ADX periods (below 20), traders can sidestep whipsaws and conserve capital, only entering when the probability of a sustained move is higher.
- For Investors: While investors have a longer time horizon, the ADX can signal major shifts. A soaring ADX during a downtrend in a stock they hold could indicate panic selling and a potential capitulation event. Conversely, a strong ADX in an uptrend confirms healthy, sustained buying interest.
- For Analysts: It provides a quantitative measure of market sentiment and momentum, useful for confirming breakout patterns or the validity of a new trend identified through fundamental analysis.
How to Use the ADX in Your Trading Strategy
The true power of the ADX is unlocked when used with the +DI and -DI lines.
- Use Case 1: Identifying a Strong Trend for Entry
- Scenario: You want to enter a trade only when a powerful trend is confirmed.
- Signal: Wait for the ADX to rise above 25. This confirms trend strength. Then, look at the +DI and -DI lines for direction. If the +DI is above the -DI, it’s a bullish trend. If the -DI is above the +DI, it’s a bearish trend. Enter in the direction of the stronger DI line when the ADX is strong.
- Use Case 2: Spotting a Trend Reversal or Emergence
- Scenario: The market has been ranging (ADX < 20), and you anticipate a new trend.
- Signal: Watch for the +DI and -DI lines to cross. A buy signal arises when the +DI intersects above the -DI. However, the signal is considered much stronger if this cross coincides with the ADX just beginning to rise from low levels (e.g., below 20), indicating the new trend has momentum.
- Use Case 3: Exiting a Trade
- Scenario: You are in a profitable trend trade and want to know when the trend is exhausting.
- Signal: The ADX peaking and starting to turn down can be an early warning that the trend is losing steam. It doesn’t mean reverse immediately, but it suggests the easiest money has been made. Consider tightening stop-losses or taking partial profits when the ADX rolls over from a very high level (e.g., above 40).
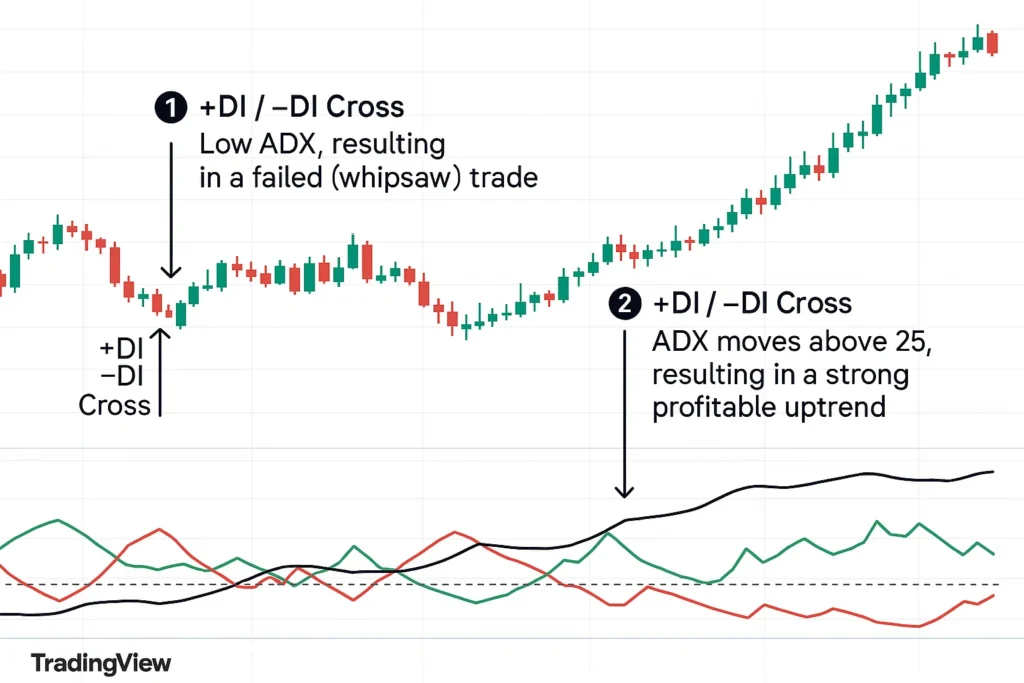
To start applying the ADX to your own trading analysis, you need a brokerage with advanced charting tools. We’ve tested and compiled a list of the best platforms for active traders to help you choose the right one.
Advanced ADX Trading Strategies
- The ADX Trend-Following System: Outline a simple, rule-based mechanical system.
- Entry: ADX > 25 AND +DI crosses above -DI (for long) OR -DI crosses above +DI (for short).
- Stop-Loss: Below the recent swing low (for long) or above the recent swing high (for short).
- Exit: When the ADX peaks and turns down by a certain percentage, or when the DI lines cross again.
- Combining ADX with Price Action: Explain how to use ADX to confirm breakouts. A breakout from a consolidation pattern (like a triangle or rectangle) is considered much more reliable if the ADX is rising from a low level, indicating the breakout has momentum.
- Using ADX for Position Sizing: Suggest a more advanced concept where traders allocate more capital to trades that initiate during a rising ADX (strong trend) and less capital during low ADX periods, thus optimizing risk-adjusted returns.
- Excellent Trend Filter: It is one of the best tools for distinguishing between trending and ranging markets, saving traders from significant frustration.
- Objective Strength Measurement: It provides a clear, numerical value for trend strength, removing subjectivity.
- Versatility: It can be applied to any time frame (from minutes to monthly) and any asset class (stocks, forex, crypto, futures).
- No Directional Bias: This is its biggest strength and weakness. It must be used with other tools, like the +DI/-DI lines, to be actionable.
- Lagging Nature: Like most smoothed averages, the ADX is a lagging indicator. It confirms strength after the trend has already begun.
- Can Give False Signals in Choppy Markets: If used in isolation, a rising ADX from a low level can sometimes just signal an increase in volatility, not the start of a new directional trend.
Common ADX Mistakes to Avoid
- Chasing the High ADX: Entering a trade when the ADX is already above 40 is often too late, as the trend may be overextended.
- Ignoring the DI Lines: Using the ADX value alone without consulting the +DI and -DI for direction is a recipe for confusion.
- Using it in Isolation: The ADX is a filter, not a standalone system. Relying on it without other confirmation (support/resistance, candlestick patterns) increases risk.
- Misinterpreting a Rising ADX: A rising ADX confirms strengthening momentum in the current direction. It is not, by itself, a bullish or bearish signal.
ADX in the Real World: A Case Study
Let’s examine the meteoric rise of NVIDIA (NVDA) in 2023-2024, a stock listed on the NASDAQ.
During the second half of 2023, NVDA entered a powerful, sustained uptrend driven by AI optimism. For months, the price chart showed a series of higher highs and higher lows. During this period:
- The ADX consistently remained above 30, often touching 40-50, signaling an exceptionally strong trend.
- The +DI line was firmly above the -DI line throughout the entire move, confirming the bullish direction.
Traders using the ADX system would have had multiple signals to enter or stay in this trend. The first strong signal would have been when the ADX crossed above 25 with the +DI above -DI. The most disciplined exit signal would have been when the ADX eventually peaked and started to decline, even as the +DI remained above -DI, indicating the trend momentum was waning.
Average Directional Index (ADX) vs Relative Strength Index (RSI)
A common point of confusion is the difference between the ADX and other momentum oscillators like the RSI.
| Feature | Average Directional Index (ADX) | Relative Strength Index (RSI) |
|---|---|---|
| What it measures | Strength of a trend. | Speed and change of price movements; identifies overbought/oversold conditions. |
| Directional Info | No (requires +DI/-DI). | Yes (momentum can hint at direction). |
| Primary Use | To determine if a market is trending or ranging. | To identify potential reversal points. |
| Typical Range | 0 to ~60+ | 0 to 100 |
Conclusion
Ultimately, the Average Directional Index is not a crystal ball, but a powerful risk-management and trend-confirmation tool. Its core value lies in its ability to keep you out of low-probability, choppy trades and keep you in high-momentum moves. As we’ve seen, it has limitations, primarily its lagging and non-directional nature—and should never be used alone. However, by incorporating the ADX into a broader strategy that includes the +DI/-DI lines and perhaps other confirming indicators, you can significantly improve your ability to identify and profit from the market’s most powerful trends. Start by applying it to your current charts to assess the true strength of the moves you are watching.
Mastering an indicator is the first step; executing trades with it requires a reliable partner. To find a platform that offers advanced charting with the ADX and lightning-fast execution, explore our in-depth reviews of the best trading platforms for technical analysts.
Related Terms
- Directional Movement Index (DMI): The full indicator system, which includes the +DI, -DI, and ADX.
- Trend Following: The broader trading philosophy that the ADX supports.
- Moving Average Convergence Divergence (MACD): Another trend-following momentum indicator that can be used to confirm ADX signals.
- Bollinger Bands: A volatility indicator; a squeeze in the bands combined with a rising ADX can signal a powerful breakout.
Frequently Asked Questions
Recommended Resources
- Investopedia’s ADX Entry – A great place for a quick refresher on the basics.
- New Concepts in Technical Trading Systems by J. Welles Wilder – The original book where the ADX was introduced. A must-read for serious technicians.
- TradingView Charting Platform – An excellent free platform to practice applying the ADX to live charts.
How did this post make you feel?
Thanks for your reaction!


